ICT Trading Explained: The Core Concepts, ICT Kill Zones and How They Fit Together
ICT trading is a vocabulary for one idea: price moves from liquidity to liquidity, engineered by the participants large enough to need it, and it does so at predictable times of day. This guide lays out the core ICT concepts in the order they are used, liquidity and the draw on it, market structure, order blocks and fair value gaps, premium and discount, the kill zones and the daily bias, and shows how a single trade assembles them, without the mysticism that surrounds the method online.
ICT trading refers to the body of concepts taught by Michael Huddleston under the name Inner Circle Trader, and it has become the most widely copied vocabulary in retail forex. Stripped of the presentation, it rests on one idea: price is moved by participants large enough to need liquidity, it travels from one pool of resting orders to the next, and it does so at the times of day when those participants are active. Everything else in the method, the structure terms, the entry models, the ICT kill zones, follows from that. This guide lays the concepts out in the order a trade uses them, gives the kill zone times in UTC and Pakistan time, assembles a worked trade, and says plainly what the method gets right and where it is oversold.
The concepts, in the order a trade uses them
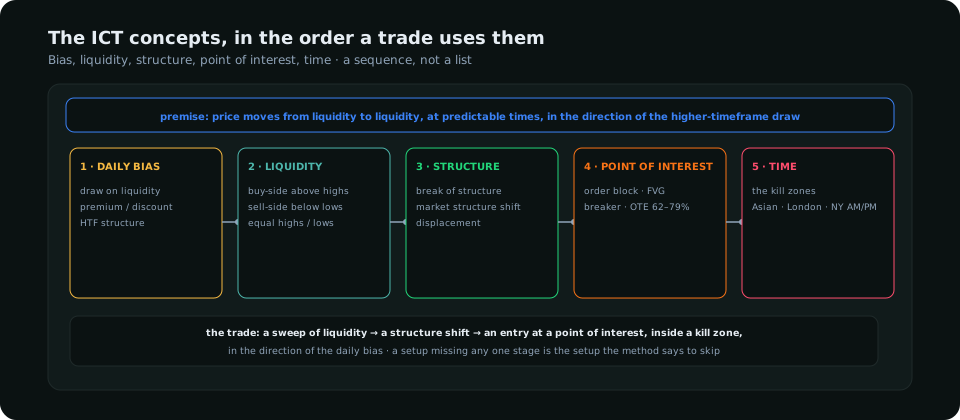
| Concept | Plain meaning | Where it is used |
|---|---|---|
| Liquidity | Resting stop and entry orders above old highs (buy-side) and below old lows (sell-side); equal highs and lows, session extremes, round numbers | Deciding where price is likely to go next (the "draw on liquidity") and where a reversal can start (after a sweep) |
| Market structure | Swing highs and lows; a break of structure continues a trend, a market structure shift reverses one; displacement is the impulsive move that does either | Confirming that a sweep has turned into a reversal |
| Order block | The last opposing candle before a displacement; where the institutional order was filled | The entry zone on the pullback |
| Fair value gap | The three-candle imbalance left by displacement | An entry zone, often overlapping the order block; price returns to fill it |
| Premium / discount | The upper and lower halves of the dealing range | Longs only in discount, shorts only in premium |
| Optimal trade entry | The 62–79% retracement of the displacement leg | Refining the entry inside the order block or gap |
| Kill zones | The windows when London and New York participants are active | Timing: the setup is only taken inside one |
| Daily bias | Which liquidity the day is likely to draw toward, from the higher-timeframe structure | The direction every lower-timeframe setup must agree with |
Each row has its own guide on this site: liquidity, structure, order blocks, fair value gaps, premium and discount and optimal trade entry. This article is about how they fit.
ICT kill zones
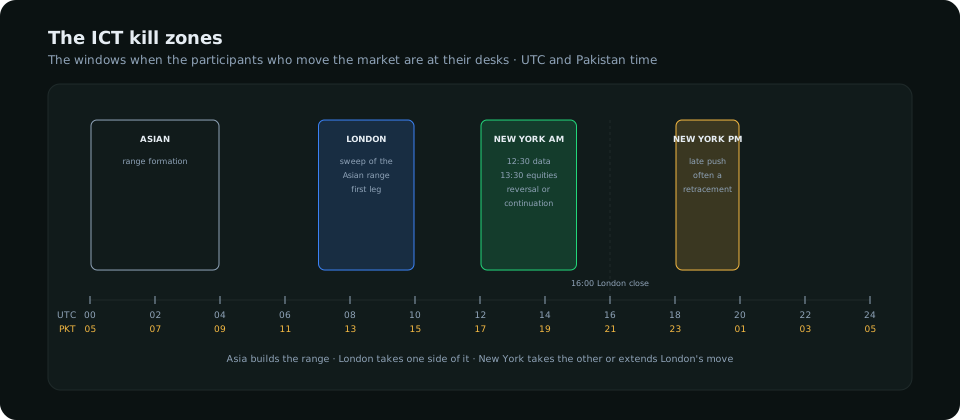
| Kill zone | UTC | Pakistan | What usually happens |
|---|---|---|---|
| Asian | 00:00–04:00 | 05:00–09:00 | A narrow range forms; its high and low become the day's first liquidity |
| London | 07:00–10:00 | 12:00–15:00 | One side of the Asian range is swept; the reversal or expansion from it is the day's first leg |
| New York AM | 12:00–15:00 | 17:00–20:00 | The 12:30 releases and the 13:30 equities open; London's leg is continued or reversed |
| New York PM | 18:00–20:00 | 23:00–01:00 | A late push, often a retracement of the day; thin after |
The kill zones are not magic hours; they are the periods when the participants who move the market are at their desks, which is why the sweeps and reversals that the method trades cluster inside them. The timings shift by an hour when the US and Europe change their clocks on different dates; the kill zone clock article handles the conversion for Pakistan and Gulf traders, and the session guide covers which pairs move in which window.
A worked trade
Daily bias: GBP/USD made a higher low on the daily chart and the nearest buy-side liquidity is the previous week's high; the draw is up, and price is in the discount half of the weekly range. Asia builds a 25-pip range. In the London kill zone, price sweeps the Asian low by 8 pips (sell-side liquidity taken), then prints a displacement candle up on the five-minute chart that closes above the last lower high: a market structure shift. The displacement leaves a fair value gap and the last red candle before it is the order block; the 62–79% retracement of the leg lands inside both. Entry at the gap's midpoint, stop below the sweep's wick, first target the Asian high (buy-side liquidity), second target the previous day's high. The trade used all five stages: bias, liquidity, structure, point of interest, time. A setup missing any one of them (a sweep with no structure shift; a perfect order block in premium against the bias; the whole sequence at 11:00 UTC in the lull) is the setup the method says to skip.
What the method gets right
- Liquidity as the organising idea. Stops cluster at obvious levels and large orders are filled against them; building the analysis around where the stops are is sound, and it is why sweep-and-reversal is the one intraday pattern with a measurable edge.
- Time of day. Session structure is real and ignored by most retail methods.
- Bias before entry. The insistence on a higher-timeframe draw before any lower-timeframe setup is the discipline most traders lack.
- Precision on the stop. Stops beyond the sweep, never inside the structure, gives the method a defined risk that indicator systems often do not.
Where it is oversold
- The "algorithm" framing. The idea that a single central algorithm moves price to deliver it to specific levels is unnecessary; order flow and stop clustering explain the same observations, and the framing encourages traders to see intent where there is only probability.
- Too many models. The method has dozens of named setups (silver bullet, judas swing, power of three, turtle soup); they are mostly the same sweep-and-reversal at different times. Learn the one and the names become labels.
- Precision theatre. Entries to the pip at the 70.5% retracement or the "consequent encroachment" of a gap imply an exactness the market does not have; a zone and a close are enough.
- No positioning or macro. The method reads only the chart. Which liquidity price draws toward over weeks is better answered by the COT report and the rate differential than by chart structure alone, and the traders who combine them have an input the pure chart reader lacks.
Using ICT concepts without the baggage
Treat the method as a vocabulary and a sequence, not a belief system. Mark liquidity, read structure by swings, enter at order blocks and gaps in the right half of the range, trade only in the kill zones, and set the daily bias from the higher timeframe and from positioning and macro. Test the one setup (sweep, shift, point of interest, in a kill zone, with the bias) over a hundred trades as the backtesting guide describes, and keep what the log supports. The smart money concepts guide is the same material in the broader vocabulary; the two overlap almost entirely.
Frequently asked
What is ICT trading?
A set of concepts, taught under the Inner Circle Trader name, built on the idea that price moves from one pool of resting orders to the next at predictable times of day. Its tools are liquidity, market structure, order blocks, fair value gaps, premium and discount, and the kill zones.
What are the ICT kill zones?
The windows when the participants who move the market are active: Asian 00:00–04:00 UTC, London 07:00–10:00, New York AM 12:00–15:00 and New York PM 18:00–20:00. In Pakistan time, 05:00–09:00, 12:00–15:00, 17:00–20:00 and 23:00–01:00.
Does ICT trading work?
Its core setup, a liquidity sweep followed by a structure shift and an entry at a point of interest inside a kill zone, has a measurable edge when traded with the higher-timeframe bias. The dozens of named variations and the algorithm framing add nothing to that edge.
Everything on SMC Terminal is analysis and education, not a recommendation to buy or sell. Figures in the example are illustrative. Trading carries a substantial risk of loss. Manage your risk.