US Q3 GDP Advance Estimate and Core PCE on 29 October 2026: What to Expect and How to Trade It
Tomorrow, 29 October 2026 at 12:30 UTC, the US publishes the advance estimate of third-quarter GDP and the September PCE inflation report in the same release, twenty hours after the Fed and forty-five minutes before the ECB. Consensus is 3.2% annualised growth with forecasts spread from 1.5% to the Atlanta Fed's 3.5%, and core PCE at 0.3% on the month and 3.1% on the year, up from 3.0%. This guide explains what each number measures, why the combination matters more than either, the four outcomes for the dollar, gold and NAS100, and a plan for a release sandwiched between two central banks.
Written on 28 October 2026, the day before the release. Consensus figures are from surveys published 26–27 October.
The US Q3 GDP advance estimate and the September PCE inflation report publish together at 08:30 Eastern on Thursday 29 October 2026, which is 12:30 UTC and 17:30 in Pakistan. On its own that is the second-biggest scheduled data release of the month; this week it lands twenty hours after the Fed's decision and forty-five minutes before the ECB's, which makes it the hinge of the week for EUR/USD, gold and the indices. Consensus is for growth of 3.2% annualised, with forecasts unusually dispersed from 1.5% to the Atlanta Fed's GDPNow at 3.5%, and for core PCE of 0.3% on the month and 3.1% on the year, up from 3.0% in August. This guide explains what each number measures, why the combination matters more than either alone, the four outcomes, and how to trade a release sandwiched between two central banks. The calendar guide covers the general method; this is the specific case.
What is being released
| Series | What it measures | Consensus | Prior |
|---|---|---|---|
| Real GDP, Q3, advance | Output growth July–September, annualised; the first of three estimates and the one that moves markets | 3.2% | Q2 1.5% in the advance estimate, later revised to 2.2% |
| GDP price index | Inflation embedded in the output measure | About 3.5% | — |
| Core PCE, September, m/m | The Fed's preferred inflation measure, excluding food and energy | 0.30–0.32% | — |
| Core PCE, y/y | Same, over twelve months | 3.1% | 3.0% |
| Headline PCE, m/m and y/y | Including energy, which oil has pushed up | 0.5% and 3.6–3.7% | — |
| Personal spending, real | Consumer demand after inflation | Slightly negative, per TD | — |
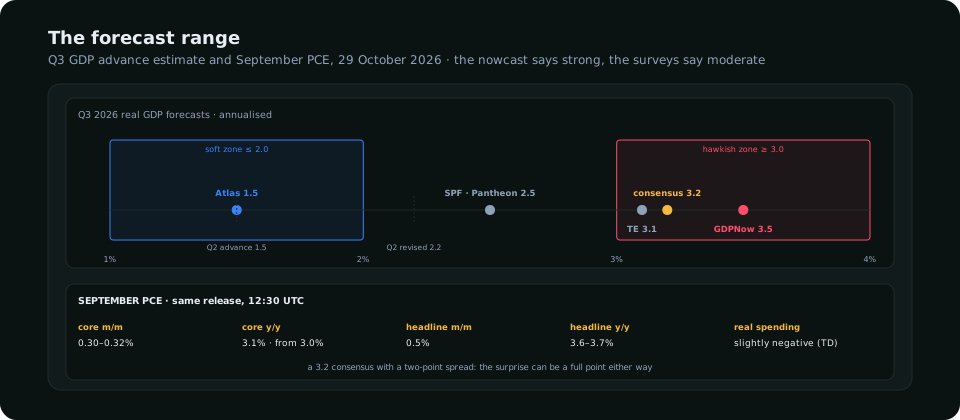
Two features of this release are unusual. The forecast range for GDP is wide: the Philadelphia Fed's survey of professional forecasters has 2.5%, Pantheon 2.5%, one independent shop 1.5% citing trade headwinds, and the Atlanta Fed's nowcast 3.5%. A consensus of 3.2% with that spread means the surprise can be a full point either way. And the Bureau of Economic Analysis is publishing the monthly PCE report on the same morning as the quarterly GDP, so the growth and inflation prints arrive in the same second and the market has to price both at once.
The forecast range
Why the combination matters more than either number
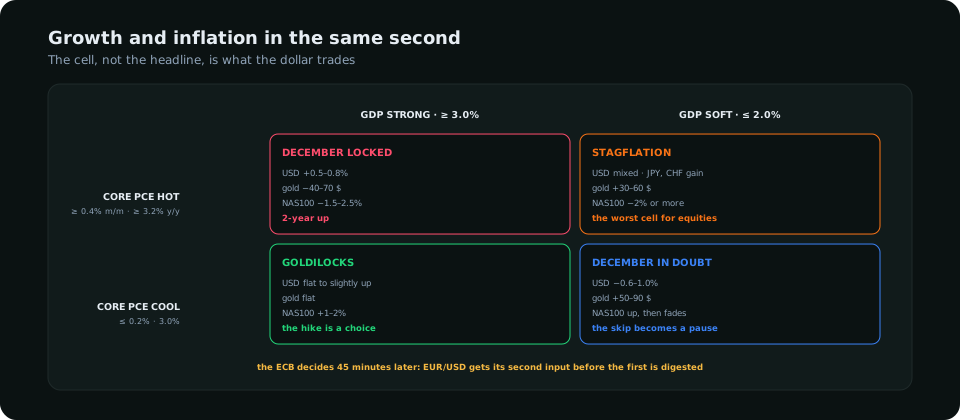
| Outcome | Read | Dollar | Gold | NAS100 |
|---|---|---|---|---|
| Strong GDP, hot PCE | December locked; three hikes by 2027 confirmed | +0.5–0.8% | −40–70 dollars | −1.5–2.5% |
| Soft GDP, hot PCE | Stagflation; the Fed is stuck | Mixed, yen and franc gain | +30–60 | −2% or more |
| Strong GDP, cool PCE | Goldilocks; the hike is a choice, not a necessity | Flat to slightly up | Flat | +1–2% |
| Soft GDP, cool PCE | December in doubt; the skip becomes a pause | −0.6–1.0% | +50–90 | Up, then fades |
The cell that matters for the week is the top-left. A print of 3.2% or better with core PCE at 0.3% or above is the confirmation of everything the Fed said the night before, and the dollar's reaction compounds: a dip on the "pause" word on Wednesday, then a rally on Thursday's data, the sequence the Fed pause guide describes. The cell that breaks the week's logic is top-right: a growth miss with hot inflation is the one combination that makes the dollar's direction genuinely uncertain, because it argues for both a hike and a cut, and that is the cell in which gold and the yen do best. The yields guide explains how to read the two-year's reaction to tell the cells apart within minutes.
A plan for 12:30 UTC
- Carry nothing in EUR/USD into it that cannot survive the ECB forty-five minutes later. A position taken on the GDP spike meets Lagarde at 13:15 and her press conference at 13:45; the ECB guide covers that half.
- Trade gold and USD/JPY on the release, not the euro. Both respond to the US rate path alone and have no second central bank in the next hour; USD/JPY's ceiling near 160 is the only constraint, covered in the yen guide.
- Read the two-year first. If GDP beats but core PCE is 0.2%, the two-year will tell you within a minute whether the market is trading growth or inflation; the cell with the bigger surprise wins.
- Wait for the 13:00 candle. The first thirty minutes of a double release produce the whipsaw; the direction that holds at 13:00 UTC, fifteen minutes before the ECB, is the day's bias for the dollar.
- NAS100 is the cleanest stagflation trade. Soft growth with hot inflation is the one cell where the index falls regardless of the dollar; the NAS100 guide covers the sizing for a 2% day.
What to read in the terminal
The macro regime read puts the two-year yield, the ten-year and the dollar together, and it is where the matrix above resolves in real time: a two-year that rises on the release is the top-left or bottom-left cell; one that falls while the ten-year rises is stagflation. The Valuation module shows gold against real yields, which is what the PCE print moves; a hot core PCE with a strong GDP pushes real yields up and the metal's fair value down, the real yields guide's mechanism in one morning.
Frequently asked
What time is the US GDP release on 29 October 2026?
08:30 Eastern, which is 12:30 UTC and 17:30 Pakistan time. The September PCE report publishes at the same moment, and the ECB decision follows at 13:15 UTC.
What is the consensus for Q3 2026 GDP?
About 3.2% annualised, with forecasts from 1.5% to 3.5%. The Atlanta Fed's nowcast is at the top of that range and the professional forecasters' survey at 2.5% near the middle. The second quarter was 1.5% in its advance estimate and was later revised to 2.2%.
What is core PCE and why does the Fed prefer it?
The personal consumption expenditures price index excluding food and energy. It weights spending more broadly than CPI and adjusts for substitution, so the Fed uses it as its inflation target measure. Consensus for September is 0.3% on the month and 3.1% on the year; anything at 3.2% or above makes a December hike close to certain.
Everything on SMC Terminal is analysis and education, not a recommendation to buy or sell. Consensus figures are as of 26–27 October 2026 and the data may differ. Trading carries a substantial risk of loss. Manage your risk.