Break of Structure (BOS): How to Read Market Structure in Forex
A break of structure is the moment a trend proves it is still alive — price closes beyond the last swing in its direction. It sounds simple, and most charts mark it wrongly. This guide defines swings so that a BOS means something, separates a break of structure from a change of character, shows how to tell a real break from a liquidity sweep, and turns the sequence into entries with a stop and a target.
Market structure is the simplest honest description of a trend: a sequence of swing highs and swing lows, each one higher than the last in an uptrend, lower in a downtrend. A break of structure (BOS) is a close beyond the most recent swing in the trend's direction — the trend extending itself. A change of character (CHoCH) is a close beyond the most recent swing against the trend — the first sign it may be ending. Everything in Smart Money Concepts is built on reading those two events correctly, and the reason so many traders struggle with SMC is that they mark swings loosely and so see breaks everywhere. This guide fixes the definitions first.
Step one: swings that count
A swing high is a candle whose high is above the highs of the candles on either side of it. On an hourly forex chart that definition produces a swing every few candles, and most of them are noise. Two filters make swings meaningful:
- Significance: the move away from the swing is at least one ATR of the timeframe. A high that price retreated from by three pips is not a swing anyone traded.
- Alternation: a swing high must be followed by a swing low before the next swing high counts. Two highs in a row with no meaningful low between them are one swing, the higher of the two.
Mark swings separately on the daily, 4-hour and hourly charts. A 4-hour swing is not an hourly swing and the breaks on each timeframe mean different things — more on that below.
Step two: BOS and CHoCH
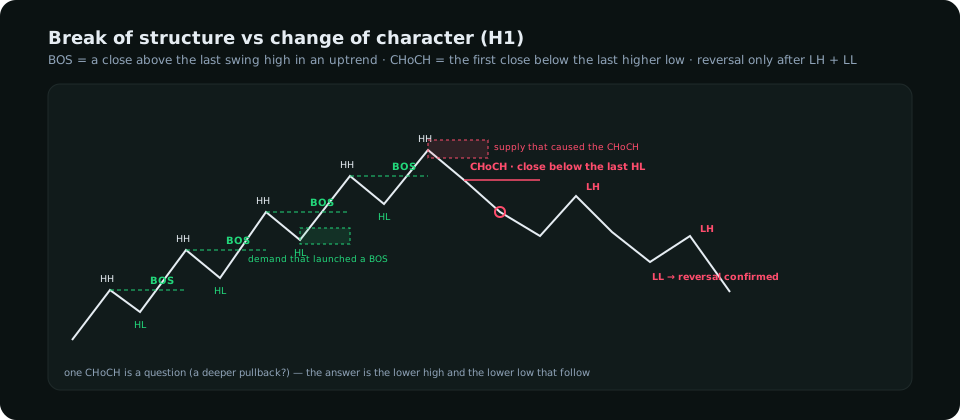
| Break of structure (BOS) | Change of character (CHoCH) | |
|---|---|---|
| Direction | With the trend: above the last swing high in an uptrend | Against the trend: below the last higher low in an uptrend |
| Meaning | The trend is continuing; the pullback is over | The sequence is interrupted; a deeper pullback or a reversal is starting |
| What to do | Look for the next pullback entry in the trend's direction | Stop adding; wait for a lower high and lower low before trading the other way |
| Zone it creates | The demand that launched the break (last down-candle before it) | The supply that caused it (last up-candle before it) |
The common error is treating a CHoCH as a reversal signal. It is not. In a strong trend, price prints a CHoCH on the hourly chart, pulls back into the 4-hour demand, and resumes — the CHoCH was just a deeper pullback. The reversal is confirmed only when a lower high forms and the next low breaks below the CHoCH low. Until then the higher-timeframe trend is still the bias.
Step three: a real break or a sweep?
Price trading beyond a swing is not a break. In forex, where stops cluster beyond every obvious high and low, price routinely pushes through a swing, triggers the stops, and reverses — a liquidity sweep. Three checks separate the two:
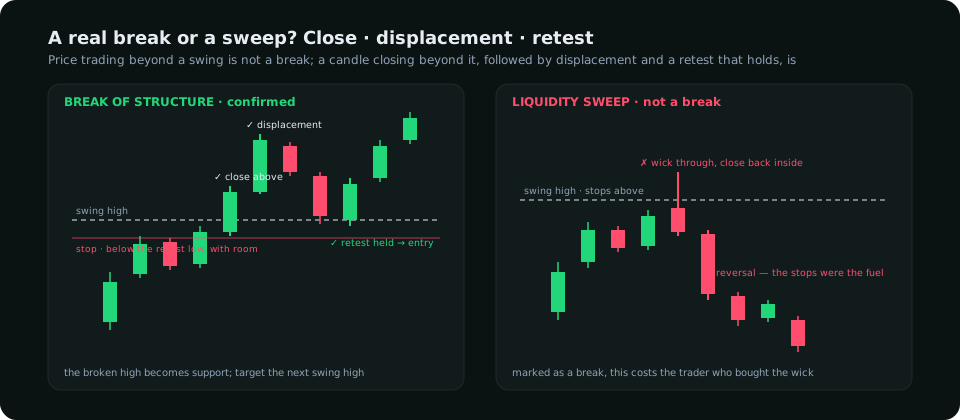
- The close. A candle body closing beyond the swing on the timeframe you are reading. A wick is a sweep until a close proves otherwise.
- Displacement. The breaking candle, or the one after it, is large relative to recent candles — one ATR or more — and leaves an imbalance behind. A break that creeps through on small candles is weak and often fails.
- The retest. Price returns to the broken level (or the imbalance / order block just below it) and holds. A break that is immediately retraced through was a sweep in slow motion.
Only when the first two are present should a break be marked; the third is where the entry lives.
Step four: three timeframes, one story
Structure on one timeframe alone contradicts itself constantly. Read it as a ladder:
| Timeframe | Question it answers | What you take from it |
|---|---|---|
| Daily | Which way is the trend? | The direction you trade; the swing that would mean a real reversal |
| 4-hour | Is this a pullback or a reversal? | The higher low (or lower high) that must hold; the zone that produced the last BOS |
| Hourly | Where exactly, and when? | The sweep, the CHoCH back in the trend's direction inside the 4-hour zone, the retest to enter on |
The rule that follows: an hourly CHoCH against the daily trend is a pullback until the 4-hour structure breaks too. An hourly CHoCH back in the direction of the daily trend, inside a 4-hour zone, is the entry. The gold structure guide works this ladder through on XAUUSD, where the swings are large enough to see clearly.
Step five: from structure to a trade
The sequence that turns these definitions into a position, in an uptrend:
- Daily and 4-hour structure bullish; price pulling back toward the 4-hour demand zone that launched the last BOS.
- On the hourly, price sweeps a recent low inside that zone (a wick below, close back above).
- Price then closes above the most recent hourly lower high — an hourly CHoCH back to the upside, with displacement.
- Entry on the retest of the hourly level just broken, or of the imbalance the displacement left.
- Stop below the sweep's low with ATR room — beyond the invalidation, not on it.
- Target the next pool of liquidity above: the previous hourly swing high first, the 4-hour swing high second. Ratios of 2 : 1 or better fall out of the geometry.
Size from the stop (the position size guide), and let context decide how much conviction the setup deserves: a bullish structure with speculators crowded long and the dollar's drivers turning against the pair is a structure to trade smaller, whatever the chart says.
Mistakes that make structure unreadable
- Marking every three-candle high. Without the ATR and alternation filters the chart is a forest of swings and every candle breaks one.
- Marking a wick as a break. The close is the evidence.
- Reading one timeframe. Hourly structure flips several times inside one daily trend.
- Trading the CHoCH as a reversal. Wait for the lower high and lower low.
- Forgetting the calendar. A break printed in the minute after a US release is the release, not structure; let the hour close.
Read strictly, market structure is the most objective thing on a forex chart: two events, a close as the evidence, three timeframes in order. Everything else in a trading method — zones, sweeps, targets — is placed relative to it.
Everything on SMC Terminal is analysis and education, not a recommendation to buy or sell. Trading carries a substantial risk of loss. Manage your risk.