Buy Side and Sell Side Liquidity: Where the Orders Sit and How Price Moves Between Them
Buy side liquidity is the pool of orders above a high: the stops of short sellers and the breakout orders of buyers. Sell side liquidity is the mirror below a low. Price moves from one to the other because large participants need those orders to fill, and the whole smart money method is a way of guessing which pool is next. This guide explains both, maps where the pools form on a chart, explains the draw on liquidity, and shows how to use the two pools as targets and as the starting point of a reversal.
Buy side liquidity is the pool of orders resting above a high: the stop-loss orders of traders who are short, and the buy-stop orders of traders waiting to buy a breakout. Both become market buys when price reaches them. Sell side liquidity is the mirror below a low: the stops of longs and the sell-stops of breakout sellers, which become market sells when hit. The names describe the orders, not the traders who placed them, which is the point most explanations miss: a short seller's stop is buy side liquidity because executing it buys. Large participants need these pools to fill size, so price travels from one to the next, and the smart money method is a way of reading which pool is the next destination. This guide maps where the pools form, explains the "draw on liquidity", and shows how to use the pools both as targets and as the places where reversals begin.
Where the pools form
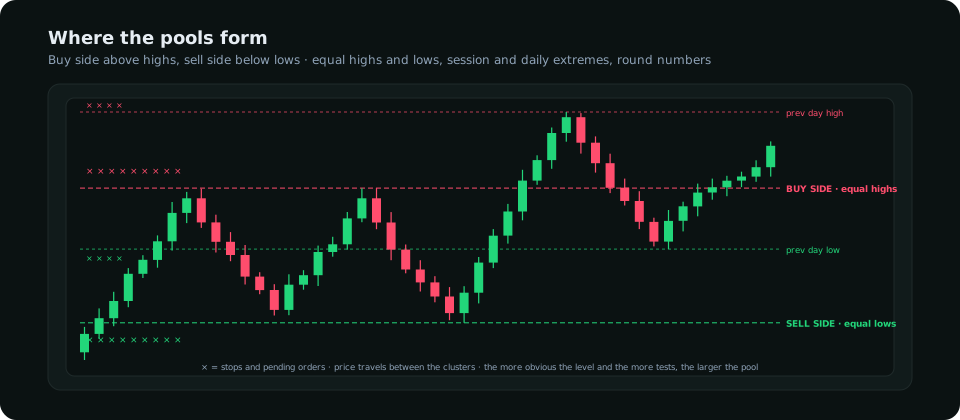
| Level | Buy side (above) | Sell side (below) | Why the pool is large |
|---|---|---|---|
| Equal highs / equal lows | Stops of shorts who sold the double top | Stops of longs who bought the double bottom | Two tests draw twice the entries; every chart shows them |
| Previous day's and week's extremes | Breakout buyers and shorts' stops | Breakout sellers and longs' stops | Watched by every participant; marked on every platform |
| Session highs and lows | Asian-range high | Asian-range low | The day's first liquidity; the London open targets them |
| Trend lines and channels | Stops below a rising line are sell side; stops above a falling line are buy side | The more touches, the more entries and the more stops just beyond | |
| Round numbers | Options strikes and resting orders | Likewise | Psychological levels attract orders on both sides |
| Swing highs and lows | Any visible high | Any visible low | Smaller pools; the obvious ones matter |
The support and resistance guide explains why a level tested three times is weaker, not stronger: each test adds entries and their stops to the pool beyond it, and a large enough pool is a target rather than a wall.
The draw on liquidity
At any moment there is a pool above and a pool below. The draw on liquidity is the one price is more likely to reach next, and deciding which is the core of a daily bias. Three inputs decide it. The higher-timeframe structure: in a daily uptrend the draw is the buy side above (the previous week's high, the equal highs); pullbacks that take the sell side below are the entries, not the destination. Which pool was just taken: after a sweep of the sell side below, with a reversal, the draw flips to the buy side above, because the stops below are gone and the ones above remain. And which pool is larger: a pair of equal highs that has held for two weeks is a bigger pool than a minor swing low from yesterday, and price gravitates to size. The daily bias guide combines these with positioning and rates into a score; the draw on liquidity is the chart's half of that read.
Pools as targets
The simplest use of the concept is the target. A long entered after a sweep of sell side liquidity targets the nearest buy side pool: the Asian high, then the previous day's high, then the equal highs above. Each is a place where price has a reason to go (the orders there) and a reason to stall (once they are consumed, the fuel is spent). Setting the first target at the nearest pool and the second at the next makes the reward-to-risk a matter of measurement rather than hope, and it explains the pattern every trader has seen of price stopping a few pips past an old high and reversing: it took the pool and had no reason to continue. The order block guide and the fair value gap guide both use "the next liquidity" as their target rule for this reason.
Pools as the start of a reversal
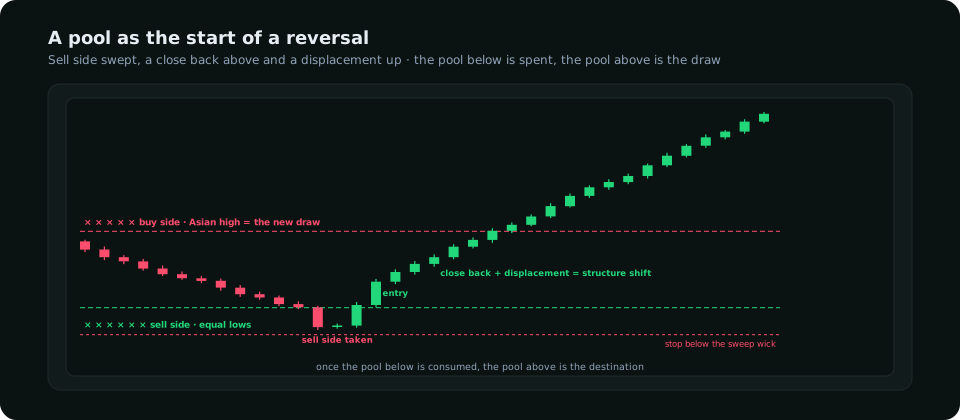
A pool is also where a reversal begins, because once it is consumed the side that was leaning on it has nothing left. Price sweeps the sell side under equal lows, the longs' stops execute as sells, a large buyer fills against them, and the close back above the lows with a displacement candle is the liquidity grab that starts the move to the buy side above. The trade: entry on the displacement close or on the pullback into the order block it leaves, stop beneath the sweep's wick, first target the nearest buy side pool. The failure mode is the same sweep without the close back: price trades through the lows and keeps going, which means the pool was not a reversal point but a step on the way to a larger pool further down. The close decides, as always.
A worked EUR/USD day
Daily structure: uptrend, higher lows intact, so the draw is the buy side at the previous week's high at 1.0920. Overnight: the Asian session builds a range of 1.0862–1.0878; the sell side below the Asian low is the obvious nearby pool, the buy side above the Asian high the next one up. London open: price sweeps 1.0862 to 1.0855, taking the Asian-low pool and the stops of the overnight longs, and the fifteen-minute candle closes back at 1.0866 with displacement. The entry is 1.0866, stop 1.0849 (below the wick), first target 1.0878 (the Asian high, buy side), second target 1.0920 (the week's high). New York: the 12:30 release pushes through 1.0878, consuming that pool, and price reaches 1.0915 by the London close, four pips short of the week's high, and stalls: the pool was reached and the day's draw was done. Every decision in that day was a question of which pool was next, and the ICT trading guide shows where the kill zones fit around it.
What positioning adds
The chart shows where the stops are; the COT report shows how many of them there are. A speculative crowd at a three-year record long is a buy side pool's worth of stops below every recent low, and a crowd at a record short (as AUD/USD showed in October 2026) is sell side liquidity's mirror: a large pool of buy stops above every recent high, which is exactly the fuel a squeeze needs. Reading the two together, the pools on the chart and the crowd in the data, is what the terminal's positioning and structure reads are for.
Frequently asked
What is buy side liquidity?
The orders resting above a high that execute as buys when reached: the stops of short sellers and the buy-stop orders of breakout buyers. It is the destination of an upward move and the fuel for the reversal that often follows reaching it.
What is sell side liquidity?
The orders resting below a low that execute as sells when reached: the stops of longs and the sell-stop orders of breakout sellers. The mirror of buy side liquidity.
How do you know which liquidity price will take next?
From the higher-timeframe trend (the draw is in the trend's direction), from which pool was just consumed (the remaining one is next), and from which pool is larger (equal highs or lows that have held for weeks). Positioning data shows how large the pools are.
Everything on SMC Terminal is analysis and education, not a recommendation to buy or sell. Figures in the example are illustrative. Trading carries a substantial risk of loss. Manage your risk.