How Forex Traders Can Use the COT Report in Market Analysis
The Commitments of Traders report is published for futures, not spot forex — but every major currency has a futures contract, and the positioning in it is the clearest free view of who is long and who is short. Here is how to translate the report into the pairs you trade, which columns matter, and three ways to use it without treating it as a signal.
Spot forex has no central exchange and therefore no public record of who holds what. That is why retail traders argue about "institutional positioning" with nothing to point at. The nearest thing to a public record exists one step away: the currency futures traded on the Chicago Mercantile Exchange, where every open contract is reported to the CFTC and published weekly in the Commitments of Traders report. The futures and the spot market are arbitraged within a few pips, so positioning in the one tells you about the other. This tutorial covers how to read the report as a forex trader — which contracts, which columns, and which uses actually hold up.
If you have never opened the report, the COT Report Explained article walks through the document itself. This one assumes you can find the numbers and asks what to do with them.
Translating futures contracts into currency pairs
Every CME currency future is quoted against the US dollar, as "units of the currency per dollar" turned the trader-friendly way round: long the euro future is long EUR/USD. The mapping to pairs is therefore direct for the dollar pairs and needs a step for the crosses.
| CFTC contract | CME code | Reads directly as | Note |
|---|---|---|---|
| Euro FX | 6E | EUR/USD | The largest FX contract; the cleanest read |
| British Pound | 6B | GBP/USD | |
| Japanese Yen | 6J | USD/JPY, inverted | Long yen futures = short USD/JPY |
| Swiss Franc | 6S | USD/CHF, inverted | Same inversion as the yen |
| Canadian Dollar | 6C | USD/CAD, inverted | |
| Australian Dollar | 6A | AUD/USD | |
| New Zealand Dollar | 6N | NZD/USD | Small contract; percentiles are noisier |
| US Dollar Index | DX (ICE) | The dollar against a basket | Reported by the CFTC too; useful as the dollar's own read |
For a cross such as EUR/JPY, compose the two legs: a bullish euro read and a bearish yen read (speculators short yen, meaning long USD/JPY) both point to EUR/JPY higher; if the legs disagree, the cross has no positioning read. This is the same leg logic a terminal applies when it shows a pair's composed bias.
Which trader group to follow
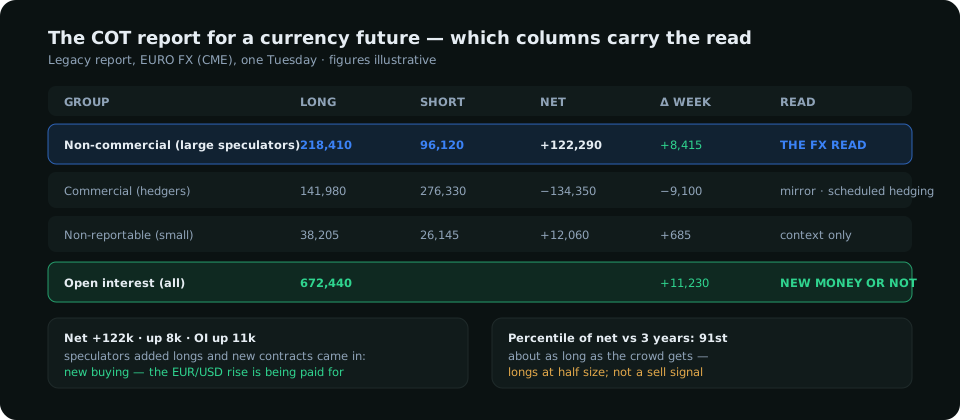
The legacy report splits positions into commercials (hedgers: corporates and banks offsetting real exposure), non-commercials (large speculators: funds, CTAs) and small traders. For currencies, the non-commercial group is the one to read, for a reason that differs from commodities: in gold or wheat the commercials are the informed producers and the speculators the trend-following crowd, but in currencies the commercial side is mostly corporate hedging on a schedule that has nothing to do with the price view. The speculators are the ones expressing an opinion, and their opinion is what reaches an extreme.
The "Traders in Financial Futures" version of the report splits the same open interest into dealers, asset managers and leveraged funds. If you use it, leveraged funds are the fast money (closest to the non-commercial read) and asset managers the slow money whose positions take months to turn. Watching the two diverge — leveraged funds cutting a long that asset managers still hold — is an early-warning read that the legacy report cannot give.
Three uses that hold up
1. Extremes as a size filter, not a reversal signal
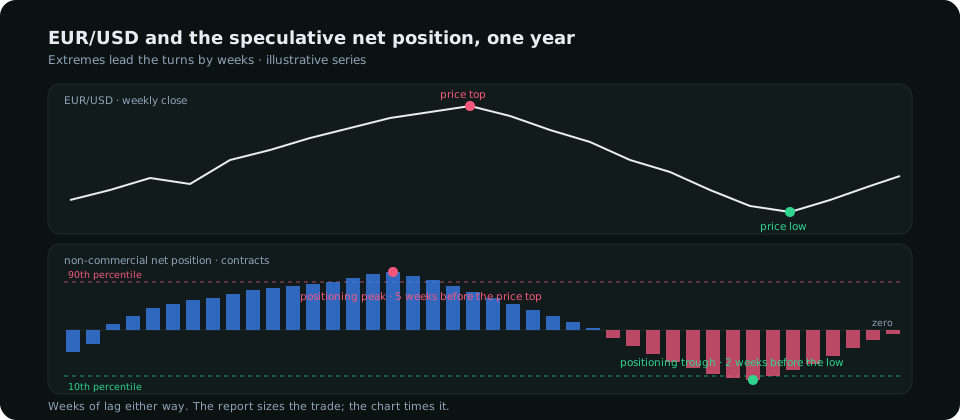
Compute where this week's net speculative position sits in its range over the last three years — the COT index. Above 90 means the crowd is about as long as it ever gets. That is not a sell signal; record longs in the euro ran for months in 2017 and 2020. It is a reason to trade longs at half size and shorts at full size, because the asymmetry of what can happen next has changed: the buyers who could push the market higher are mostly already in.
2. The change, not the level
Week-over-week change in the net position, read with open interest, tells you what the speculators did. Net long rising with open interest rising is new buying — the move is being paid for. Net long rising with open interest falling is shorts covering — the price rose because sellers left, not because buyers arrived, and the move is thinner than it looks. The daily version of this read, from exchange volume and open interest, is the subject of the terminal's Volume & OI tab; the COT gives it weekly for the whole speculative community.
3. Confirmation for a structural trade
A trade from the chart — a sweep and structure shift on the 4-hour chart — carries more weight when the positioning explains why it should work. A sweep of equal highs in EUR/USD with speculators at a 95th-percentile long is a sweep with a crowd behind it to unwind. The same sweep at the 40th percentile is a wick. The chart is identical; the report is the difference.
The timing you have to respect
The report is published Friday at 15:30 Eastern for positions as of the previous Tuesday. By the time you read it, three trading days have passed. This is fine for what the report is good at — posture changes slowly — and fatal for what it is not: it will never tell you what happened on Thursday. Read it on the weekend, set the week's size rules from it, and do not look at it again until the next one. Traders who try to trade "the COT release" on Friday afternoon are trading a three-day-old photograph of a market that has moved.
Three mistakes that turn the report into a losing signal
- Fading every extreme. The crowd is usually right for most of a trend; it is wrong at the end, and the report does not say when the end is. Size, don't fade.
- Reading levels without history. "Net long 120,000 contracts" means nothing on its own. The same number is extreme for the Swiss franc and ordinary for the euro. Always a percentile, never a raw count.
- Mixing the report versions. The legacy report's non-commercial figure and the financial-futures report's leveraged-funds figure are different populations. Pick one series and keep its history; a percentile across mixed series is noise.
A weekly routine
- Saturday: for each pair you trade, note the net speculative position's percentile, its weekly change, and open interest's change. Three numbers per leg.
- Compose the pairs: dollar pairs directly, crosses from the two legs.
- Write the week's size rule for each: full, half, or no trades against the extreme.
- During the week, trade the chart. The report has already done its job.
Done that way the COT report is not a prediction. It is the single most reliable free answer to the question every forex trader asks and almost none can check: who is already in this trade?
Everything on SMC Terminal is analysis and education, not a recommendation to buy or sell. Positioning figures are illustrative; the current report is at cftc.gov. Trading carries a substantial risk of loss. Manage your risk.