Forex Backtesting: How to Test a Strategy Without Cherry-Picking Results
Forex backtesting fails more often from the tester than from the strategy: rules that are tightened after seeing the losses, data that stops at a convenient date, costs that are left out. This guide sets out a procedure that makes cherry-picking hard: rules written before the data is opened, a sample large enough to contain the bad streaks, costs modelled honestly, a walk-forward split, and a results table that reports the numbers that predict live performance.
Forex backtesting answers one question: if I had traded these exact rules over this period, what would have happened? It cannot tell you what will happen, and it cannot even answer its own question unless the rules were fixed before the data was examined, the period was chosen without reference to the results, and the costs were real. Most backtests that look good fail one of those three conditions, usually without the tester noticing. This guide sets out a procedure built to make the failures visible: rules first, then data, then costs, then a split that keeps part of the history unseen until the end, and a results table that reports the figures that actually predict live trading.
Step 1: write the rules before opening the data
Every rule needs to be mechanical enough that two people applying it to the same chart would place the same trades. "Enter on a pullback to the zone" is not a rule; "enter at the first fifteen-minute close back above the order block's high after price has traded into its lower half" is. Write down: the market and timeframe, the setup definition, the entry trigger, the stop rule, the target or exit rule, the position-size rule, the sessions and days allowed, and the events excluded. Save the document with a date. Any change to it after the test starts is a new strategy requiring a new test, and the number of changes is a record of how much the result was fitted. The strategy selection guide covers what a complete rule set contains.
Step 2: choose a sample that contains the bad years
A sample is adequate when it includes at least one regime the strategy should dislike. A trend strategy tested only on 2022 (a year of relentless dollar trend) will look brilliant and fail in 2023's ranges. Three years of data on a daily or four-hour strategy, or six months on an intraday one, is the minimum, and the sample must cover at least one period of low volatility, one of high, and one sustained range. Pick the dates before looking at any trades, and do not end the sample at the strategy's last good month. The number of trades matters more than the number of years: fewer than a hundred trades and the win rate has a confidence interval wide enough to drive a truck through; two hundred is a reasonable floor for a discretionary setup.
Step 3: model the costs honestly
| Cost | Typical size | Effect on an intraday strategy | How to model it |
|---|---|---|---|
| Spread | 0.6–1.5 pips majors; 20–40 cents gold | The largest cost; 10-pip targets lose 10–15% of their edge to it | Deduct the full spread from every trade; use the session's spread, not the quoted minimum |
| Slippage | 0.2–1 pip normal; 5–20 pips at releases | Turns tight stops into wider ones | Add 0.5 pip to every fill, 5 pips to any fill within 5 minutes of a red release |
| Swap | −0.5 to −2 pips per night on most pairs | Negligible intraday, material for swing trades | Deduct per night held |
| Commission | 3–7 dollars per round lot | Small per trade, large over hundreds | Deduct per trade |
A strategy whose edge disappears when 1 pip of total cost is added did not have an edge; it had a rounding error. Re-run the test at double the modelled cost before trusting it.
Step 4: split the data and walk it forward
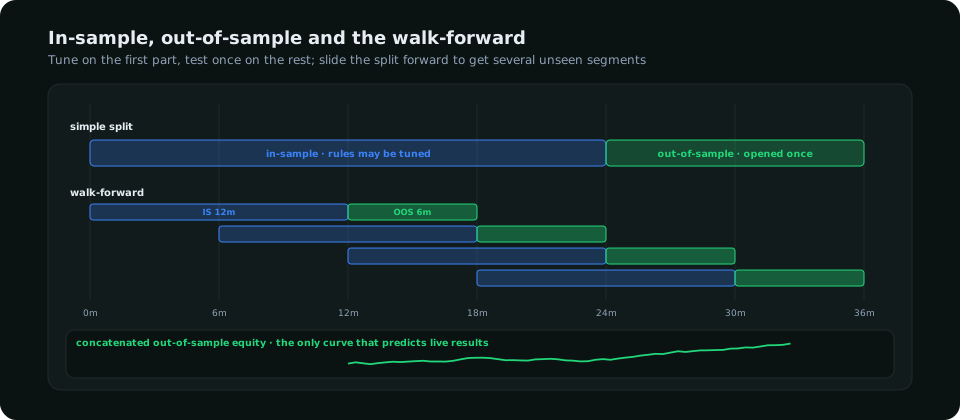
Tune the rules, if at all, only on the in-sample portion, the first two-thirds of the history. Then run the final rules once on the out-of-sample third and report that result, whatever it is. If the out-of-sample result is much worse than the in-sample one, the rules were fitted to the in-sample data and the strategy is weaker than it looked; if it is similar, the edge is more likely real. A walk-forward repeats this with a sliding window, producing several out-of-sample segments whose concatenated equity curve is the best available preview of live trading. Any change to the rules after the out-of-sample test invalidates it: the next test needs new, unseen data.
The biases that produce false results
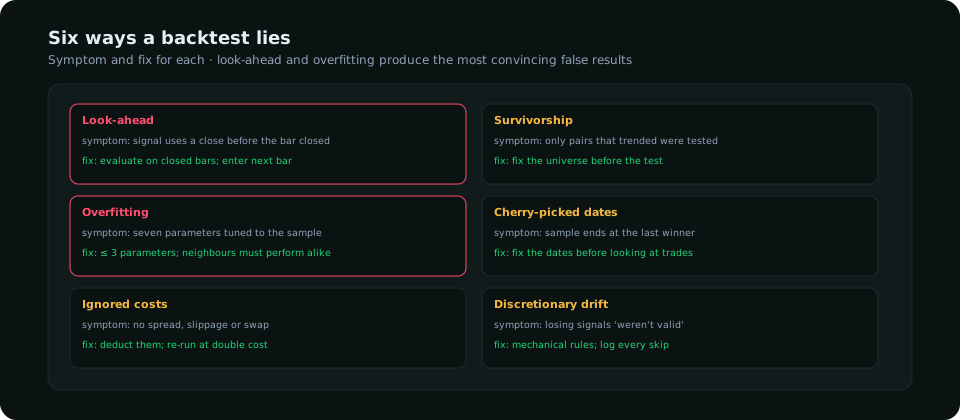
- Look-ahead: any rule that uses information from after the decision point, most commonly a signal computed on a bar's close and executed at that bar's open. Evaluate every rule on closed bars and enter on the next bar.
- Overfitting: a strategy with seven tunable parameters will fit any sample. Keep parameters to three or fewer, and check that values on either side of the chosen one perform similarly. An edge that exists only at a 21-period average and vanishes at 19 and 23 is noise.
- Survivorship: testing only the pairs that trended during the sample. Choose the universe before the test.
- Discretionary drift: the most common in manual backtests. The tester skips a losing signal because "it obviously wasn't a valid setup" and takes a winning one that was marginal. Log every signal, including the ones skipped, and count the skips.
Step 5: report the numbers that matter
| Metric | Why | Red flag |
|---|---|---|
| Trade count | Everything else is unreliable below 100 | Fewer than 100 |
| Win rate and average R | Together they give expectancy: W × avgWin − (1 − W) × avgLoss | Win rate above 70% with R below 1 (one large loss away from the mean) |
| Expectancy per trade, after costs | The edge in R per trade | Below 0.1R; vanishes when costs are doubled |
| Maximum drawdown and longest losing streak | What the trader will have to live through | A drawdown deeper than the trader would sit through |
| Out-of-sample vs in-sample expectancy | The overfitting test | Out-of-sample under half of in-sample |
| Result by year, session and pair | Shows where the edge comes from | One year or one pair supplies all the profit |
The longest losing streak is what sets the risk per trade the strategy can bear; the expectancy is what makes it worth bearing. The reward-to-risk guide explains how the two combine.
Too good to be true
A backtest showing a win rate above 75%, a profit factor above 3, a drawdown under 5% and a smooth equity curve is almost always a backtest with a flaw, not a strategy with an edge. Real discretionary edges in liquid forex markets produce expectancies of 0.1–0.4R per trade with 40–60% win rates and drawdowns of 10–20% along the way. Results far better than that are the signal to go looking for the look-ahead, the fitted parameter or the skipped losers, not to open a live account. The strategies guide describes what realistic rule sets look like, and the ATR article covers the volatility normalisation that keeps a strategy's stops consistent across the regimes a good sample contains.
Frequently asked
How many trades does a forex backtest need?
At least a hundred for a rough read, two hundred or more for a win rate you can plan around. A sample's trade count matters more than its calendar length.
Can I backtest a discretionary strategy?
Only once it is written as mechanical rules. The test of a discretionary strategy is whether its rules can be written down at all; if they cannot, forward-test it in a journal with a small size instead.
Is manual backtesting valid?
Yes, if every signal is logged including the ones skipped, costs are deducted, and the out-of-sample portion is kept unseen until the end. Manual tests are slower but catch rule ambiguities that code hides.
Everything on SMC Terminal is analysis and education, not a recommendation to buy or sell. Figures in the example are illustrative. Trading carries a substantial risk of loss. Manage your risk.