WTI Crude at $100 and the Strait of Hormuz: Record Tanker Attacks, the $14 Brent–WTI Spread and the Forex Read
WTI crude settled at $99.90 on 27 October 2026 after trading above $101 in Asia, with Brent at $113.88, as attacks on shipping in the Strait of Hormuz reached the highest monthly count on record: 28 vessels in October, seven oil tankers on 22 October alone. Gulf crude exports have fallen for four straight weeks and transits are near 60% of normal. This guide explains why the $100 line matters, why Brent trades $14 over WTI when the normal gap is $3–5, what the strait carries and what bypasses it, and which currencies move with each barrel.
Written on 28 October 2026. Prices are the 27 October settlements; attack counts are from reporting dated 22–27 October.
WTI crude at $100 is the line the whole market is watching, and it has been crossed in both directions this week. US crude settled at $99.90 on Monday 27 October 2026, down $1.86 on the day, after trading above $101 in the Asian session; Brent settled at $113.88. The reason is the Strait of Hormuz. Attacks on commercial shipping in and around the strait reached the highest monthly count since records began, with 28 vessels attacked in October and seven oil tankers targeted on 22 October alone. Gulf crude exports have fallen for four consecutive weeks, weekly transits are running near 60% of normal, and talks have not produced a breakthrough. The US military says it has escorted 1.5 billion barrels out since the conflict began, which is why oil still flows and why the price is $100 rather than $150. This guide explains why the round number matters, why Brent is trading $14 over WTI when the normal gap is $3–5, what the strait carries and what bypasses it, the closure scenario, and which currencies move with each barrel. Yesterday's oil shock guide covers the macro transmission; this piece is about the strait and the spread.
Where the market is
| Item | Latest | Note |
|---|---|---|
| WTI | $99.90 settle, 27 October; above $101 intraday | The $100 line has been crossed both ways this week |
| Brent | $113.88 settle; $116.72 on 23 October, a six-month high | The seaborne benchmark carries the Hormuz premium |
| Brent–WTI spread | About $14 | Normal is $3–5; the gap is the strait's price |
| Attacks | 28 vessels in October; seven oil tankers on 22 October | Highest monthly count on record |
| Gulf exports | Down four consecutive weeks; transits near 60% of normal | Kpler counted about 10 million barrels a day still crossing in early October |
| Escorts | 1.5 billion barrels escorted out, per the US Army | The reason there is still a market |
| Diplomacy | Tehran talks (Iran, Saudi Arabia, Pakistan, Turkey) on 27 October; no breakthrough | Each headline is worth $2–3 for a session |
Why Brent trades $14 over WTI
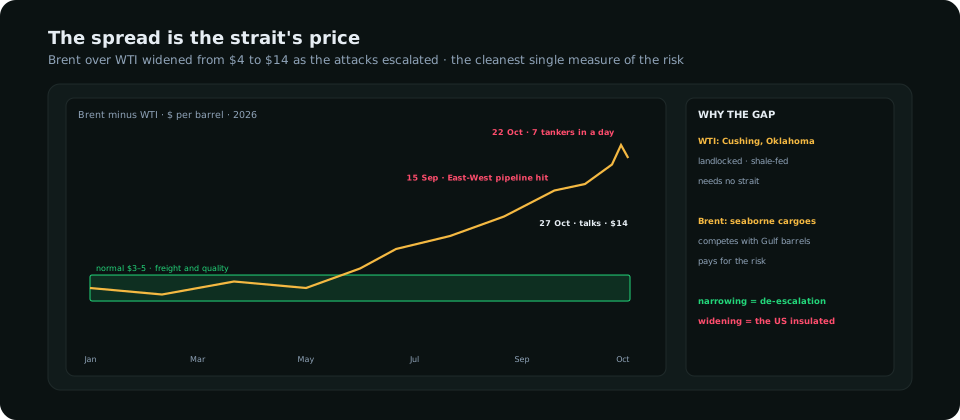
West Texas Intermediate is priced at Cushing, Oklahoma, a landlocked hub fed by US shale that does not need the Strait of Hormuz for anything. Brent is priced on seaborne North Sea cargoes that compete directly with Gulf crude in the global market, so when Gulf supply is threatened, Brent carries the premium and WTI only follows at a distance. In a normal year the gap is $3–5, explained by freight and quality. At $14 it is the market's price for the probability that seaborne supply gets worse, and it is the cleanest single number to watch: a narrowing spread on a diplomatic headline means the strait risk is being priced out even if both benchmarks fall; a widening spread while WTI is flat means the risk is rising and the US is insulated. For a currency trader the spread is also the separation between the dollar's exporter channel, which runs on WTI, and the importers' pain, which runs on Brent.
What the strait carries and what bypasses it
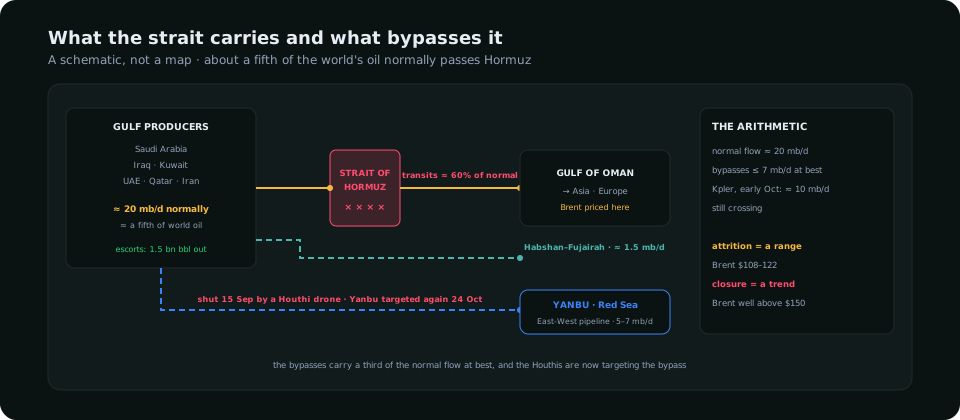
In a normal year about 20 million barrels a day pass through the strait, roughly a fifth of global consumption, from Saudi Arabia, Iraq, Kuwait, the UAE, Qatar and Iran. There are two bypasses. Saudi Arabia's East-West pipeline carries up to 5–7 million barrels a day to Yanbu on the Red Sea, which is the route the market has relied on since the spring; a Houthi drone strike shut it on 15 September and Yanbu was targeted again on 24 October, which is why the attacks on Saudi infrastructure matter as much as the attacks on tankers. The UAE's Habshan–Fujairah line carries about 1.5 million barrels a day to the Gulf of Oman. Together the bypasses move a third of the normal flow at best. The gap between 20 million and what the escorts and bypasses can deliver is the supply shock, and the Kpler count of about 10 million barrels a day still crossing in early October is the number that says the shock is real but partial.
The closure scenario
A full closure, meaning no commercial transits for weeks, is the tail the $14 spread is pricing. The arithmetic: the loss of 8–10 million barrels a day beyond what bypasses carry is larger than any supply disruption in history, strategic reserves cover it for months not years, and the price that rations demand of that size is well above $150 for Brent. That scenario has not happened because the escorts work, because Iran's own exports also pass the strait, and because every party at the Tehran table loses from a closure. The scenario that is happening is attrition: enough attacks to cut transits by 40%, keep insurance and freight rates at records, and hold Brent above $110 without producing the political response a closure would. For traders the distinction matters because attrition is a range and closure is a trend; Brent's $108–122 range of the past fortnight is the attrition regime, and a daily close above $122 with the spread widening past $16 is the market starting to price the other one. The fundamental analysis guide covers how a regime change like that reaches the currency market.
Which currencies move with each barrel
| Currency | Barrel it follows | Direction when oil rises | Note |
|---|---|---|---|
| Canadian dollar | WTI | Stronger | Exporter priced off the US benchmark; USD/CAD fell 240 pips from its October high; the BoC guide covers today's decision |
| Norwegian krone | Brent | Stronger | The purest Brent currency among liquid ones |
| Japanese yen | Brent | Weaker | Imports nearly all its energy; loses twice through the trade balance and the Fed |
| Indian rupee, Korean won | Brent | Weaker | Gulf-dependent importers; the rupee is the most exposed liquid emerging currency |
| Euro | Brent | Weaker | Importer with a flat economy; EUR/USD at a 2026 low of 1.1113 |
| US dollar | Both | Stronger | Net exporter and the Fed's hiking cycle; the spread widening is dollar-positive |
| Gold | Both, through yields | Weaker so far | The inflation-to-yields channel has beaten the fear bid; the gold guide covers why |
A plan for a $100 barrel
- Watch the spread, not the price. WTI at $100 with a $14 spread is a different market from WTI at $100 with a $5 spread. Narrowing on a headline is the de-escalation trade: short USD/JPY, long AUD/USD, long gold for a session. Widening is the other direction.
- $100 is a round number, not a level. The options market has strikes there and the headlines treat it as a line, so expect it to be swept both ways; the levels that matter are the 23 October high and the post-Tehran low.
- Trade CAD against JPY, not against the dollar, for the oil view. It isolates the exporter-importer channel from the Fed. Its ceiling is the yen intervention zone covered in the yen guide.
- Size for the headline. A tanker attack or a ceasefire headline moves oil $3–5 in minutes and USD/CAD 60–100 pips. The risk management guide sets out the lot for a stop that has to sit beyond that.
What to read in the terminal
The intermarket panel scores oil against the dollar, yields and the risk currencies, and the divergence between WTI and Brent in that panel is the spread read above. The Positioning dashboard shows the speculative crude long, which has been crowded since September; a crowded long into a diplomatic headline is why the de-escalation days are $3 rather than $1. The managed money guide covers the read.
Frequently asked
Why is oil at $100 in October 2026?
Attacks on shipping in the Strait of Hormuz reached a record 28 vessels in October, Gulf crude exports have fallen for four weeks with transits near 60% of normal, and Houthi strikes have hit the Saudi pipeline that bypasses the strait. WTI settled at $99.90 on 27 October and Brent at $113.88.
Why is Brent so much higher than WTI?
Brent is priced on seaborne cargoes that compete with Gulf crude and so carries the risk premium of the strait; WTI is priced at a landlocked US hub supplied by shale that does not need the strait. The normal gap is $3–5; at $14 the difference is the market's price for the probability that seaborne supply gets worse.
What happens to oil if the Strait of Hormuz closes?
About 20 million barrels a day normally pass it, and the bypass pipelines carry a third of that at best. A full closure would remove more supply than any disruption in history and would need a Brent price well above $150 to ration demand. The market is pricing attrition, not closure: Brent in a $108–122 range with a wide spread. A close above $122 with the spread past $16 would be the first sign of the other scenario.
Everything on SMC Terminal is analysis and education, not a recommendation to buy or sell. Prices and counts are as of 22–27 October 2026 and change continuously. Trading carries a substantial risk of loss. Manage your risk.