Australia CPI Jumps to 4.3%: AUD/USD Forecast, the RBA November Hike and the RBNZ Surprise
Australia's inflation data on 28 October 2026 came in hot: headline CPI rose to 4.3% year on year against 4.2% expected, and the third-quarter trimmed mean rose 1.0% against the RBA's own 0.8% forecast. Markets moved the odds of a Reserve Bank hike on 3 November to about 90%, AUD/USD made a one-month high at 0.7050, and an hour later the RBNZ held at 2.75% in a 4–3 vote that nobody expected, sending the kiwi down 1.3% and AUD/NZD through its range. This guide covers the print, what the RBA does next, the AUD/USD levels into tonight's Fed, and the cross that the day set up.
Written on 28 October 2026 after the Australian and New Zealand releases and before the Fed. Levels are from the Asian session.
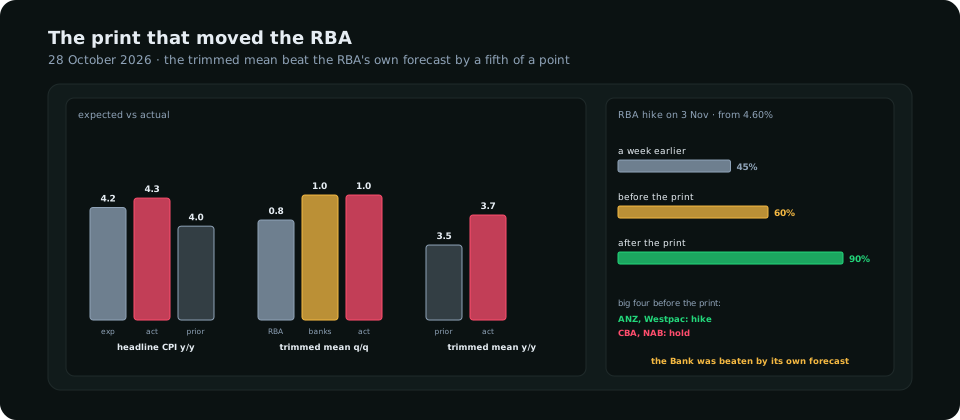
Australia's CPI was the first release of the central bank super week and it did not disappoint the hawks. Headline inflation for September rose to 4.3% year on year against 4.2% expected and 4.0% the month before, and the quarterly trimmed mean, the measure the Reserve Bank actually targets, rose 1.0% in the third quarter against the RBA's August forecast of 0.8%, taking the annual rate to about 3.6–3.7% depending on the series. Governor Bullock had said the week before that inflation was "far too high"; the data agreed. Pricing for a hike from 4.60% at the 3 November meeting moved to about 90% from roughly 60% beforehand, and AUD/USD printed a one-month high at 0.7050. An hour later the Reserve Bank of New Zealand, expected by every major bank and about 90% of the market to hike, held at 2.75% in a 4–3 vote; the New Zealand dollar fell 1.3% and AUD/NZD broke higher. This guide covers the print, what the RBA does next, the AUD/USD levels into tonight's Fed, and the divergence trade the morning created. The 24 October AUD/USD analysis covers the chart structure this print landed on.
The print
| Measure | Expected | Actual | Prior |
|---|---|---|---|
| Headline CPI, September, y/y | 4.2% | 4.3% | 4.0% |
| Trimmed mean, Q3, q/q | 0.8% (RBA), 0.9–1.0% (banks) | 1.0% | — |
| Trimmed mean, y/y | About 3.6% | About 3.6–3.7% | 3.5% |
| RBA November hike, priced | About 60% before | About 90% after | 45% a week earlier |
Two things make this print more than a decimal. The trimmed mean is the number that strips out the energy spike; a 1.0% quarter means price pressure has spread beyond petrol, which is the RBA's stated condition for moving again. And the beat was against the Bank's own August forecast, not just the market's, which makes a hold on 3 November a Board overruling its staff. The big four banks were split before the release, ANZ and Westpac for a hike and CBA and NAB for a hold; the hold camp's argument was that trimmed mean of 0.9% or less would keep the Board patient, and 1.0% removed it. The rate path guide explains why a central bank beaten by its own forecast moves.
What the RBA does on 3 November
A 25 basis point hike to 4.85% is the base case at about 90%. The question that matters for the currency is what the statement says about the one after: a hike described as completing the response to the energy shock caps AUD/USD near 0.71; a hike with language about inflation being broad-based and the Board "prepared to act further" is a path, and a path is what carries the Australian dollar through 0.7100 toward the 2026 highs. The Board also has the problem the Bank of Canada has today, covered in the BoC guide: oil at $100 raises the headline and squeezes the consumer at once. Australia, unlike Canada, is a net energy exporter with a strong terms-of-trade position on gas and coal, which is why the RBA has more room to hike than its peers and why the market gives it 90%.
AUD/USD into the Fed
| Level | Meaning |
|---|---|
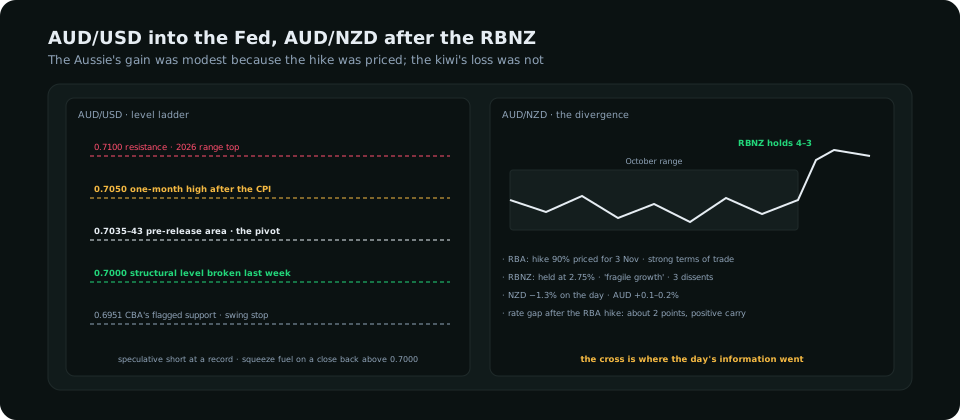
| 0.7100 | Resistance and the top of the 2026 range; a close above it on a dovish Fed opens the highs |
| 0.7050 | The one-month high printed after the CPI; the sweep target for a hawkish Fed |
| 0.7035–0.7043 | The pre-release area and the day's pivot |
| 0.7000 | The structural level the pair broke above last week; a daily close back below it fails the breakout |
| 0.6951 | The support CBA flagged for a sharp down day; the stop reference for swing longs |
The pair gained only 0.1–0.2% on a print that moved RBA pricing by thirty points, which tells you the market had most of the hike priced and is waiting for the Fed. The setup is the one every risk currency has tonight: a hawkish Fed drives the pair back down through the 0.7000 area, and the question is whether the daily candle closes back above it. With the speculative short in the Australian dollar at a record, covered in the COT index guide, a close back above 0.7000 after a Fed-driven dip is the squeeze setup; a close below 0.6951 is the failed breakout and the shorts were right. The Fed pause guide covers the dollar side of that.
The RBNZ surprise and the AUD/NZD trade
The Reserve Bank of New Zealand held the cash rate at 2.75% in a 4–3 vote, against roughly 90% pricing and the forecasts of all five major New Zealand banks; the three dissenters wanted 3.00%. The guidance said tighter policy is still likely, but conditional, citing lower-than-expected inflation, subdued wages and fragile growth. The kiwi fell 1.3% against the dollar in Asian trade. The information is in the divergence: Australia's central bank has been beaten by its own forecast and will hike into a strong terms-of-trade position; New Zealand's has just told the market its economy cannot take the hike it had promised. AUD/NZD broke above its October range on the morning. The trade is the pullback into the old range top with a stop below the pre-RBNZ low, held into 3 November when the RBA delivers the other half of the divergence. It carries positive interest, since the Australian rate will exceed the New Zealand rate by about two points after the hike, which the interest rates guide explains is the cross's underlying driver. The swing trading guide covers how to hold it through the week's remaining decisions.
What to read in the terminal
The Positioning dashboard shows the Australian dollar's speculative short at a record and the New Zealand dollar's at a lesser extreme; the asymmetry is why the kiwi fell further than the Aussie rose, and why a squeeze in AUD/USD has more fuel than a squeeze in NZD/USD. The macro regime read puts Australia's two-year yield at a premium to the dollar's that today's print widened; the sentiment guide explains why positioning and rates together, not either alone, are the read on this pair.
Frequently asked
What was Australia's CPI in September 2026?
Headline CPI rose 4.3% year on year, against 4.2% expected and 4.0% in August. The third-quarter trimmed mean, the RBA's preferred measure, rose 1.0% in the quarter against the Bank's own forecast of 0.8%, and about 3.6–3.7% over the year.
Will the RBA raise rates in November 2026?
Markets price a hike from 4.60% to 4.85% on 3 November at about 90%, up from about 60% before the inflation data. The statement's language about further moves will matter more for the Australian dollar than the hike itself.
Why did the New Zealand dollar fall on 28 October 2026?
The RBNZ held its cash rate at 2.75% in a 4–3 vote when a hike to 3.00% was about 90% priced, citing lower inflation, subdued wages and fragile growth. The kiwi fell about 1.3% and AUD/NZD broke higher as the Australian data pointed the other way.
Everything on SMC Terminal is analysis and education, not a recommendation to buy or sell. Data and prices are as of 28 October 2026 and change continuously. Trading carries a substantial risk of loss. Manage your risk.