Optimal Trade Entry (OTE): The 62–79% Retracement Zone, How to Draw It and When It Fails
Optimal trade entry is the ICT name for a precise idea: after a displacement leg, the best place to join the move is the 62–79% retracement of that leg, where the order block and the fair value gap usually sit and where the stop beyond the leg's origin is tightest. This guide shows how to anchor the fibonacci correctly, what the 70.5% midpoint means, how OTE combines with structure and liquidity, the arithmetic that makes the zone worth the wait, and the three conditions under which it fails.
Optimal trade entry, usually shortened to OTE, is the ICT term for the retracement zone between 62% and 79% of a displacement leg. The logic is simple and the precision around it is often overstated. After price sweeps a low and displaces up through structure, the move will usually pull back before continuing; the deeper the pullback the better the entry price and the tighter the stop beyond the leg's origin, but a pullback that goes too deep means the leg has failed. The 62–79% band is where those two forces balance, and it is also where the order block that started the leg and the fair value gap inside it tend to sit. This guide shows how to anchor the tool correctly, the arithmetic that makes the zone worth waiting for, the confirmation to require, and the three conditions under which it fails.
Anchoring the fibonacci correctly
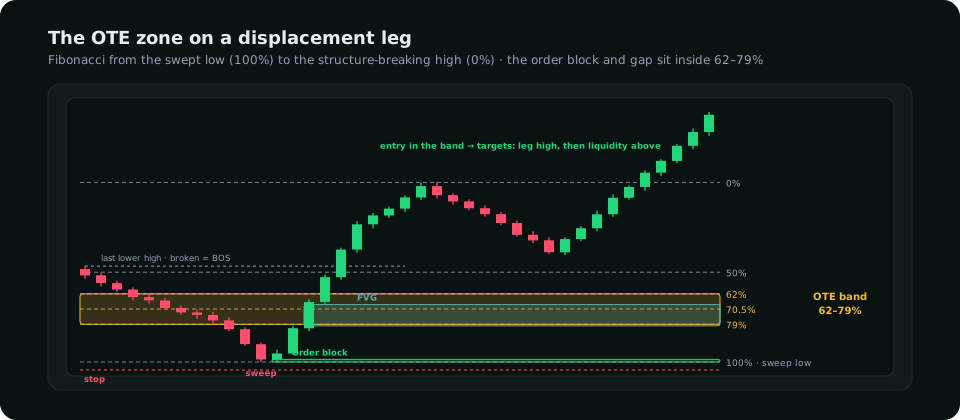
The leg is the whole thing, and most OTE mistakes are anchoring mistakes. For a long: the 100% anchor is the low of the sweep (the wick, not the body), and the 0% anchor is the high of the displacement leg at the point it has broken structure, that is, closed above the last lower high. The leg must contain the break of structure; a fibonacci drawn on a leg that merely bounced is a fibonacci on noise. The three levels inside the leg: 62% (the shallow edge), 70.5% (the midpoint, which ICT treats as the ideal), and 79% (the deep edge). The band between 62 and 79 is the zone. For a short, mirror everything: 100% at the sweep high, 0% at the leg's low.
| Level | Meaning | Use |
|---|---|---|
| 50% | Equilibrium of the leg | Not an entry; the point below which the pullback becomes a discount |
| 62% | Shallow edge of the OTE | First limit order, or the level a confirmation must have reached |
| 70.5% | Midpoint of the band | The usual single-entry level; typically inside the order block |
| 79% | Deep edge of the OTE | Last entry; beyond it the leg is in doubt |
| 100% | The sweep low | The stop sits just beyond it |
Why the band is where it is
Two things make 62–79% the zone rather than 50% or 90%. First, it is where the order block and the gap physically are: a displacement leg that starts from a sweep leaves its origin candle and its imbalance in the lower part of the leg, usually between 60% and 80% of it, so the fibonacci is a way of finding those zones with one tool. Second, it is where the reward-to-risk becomes acceptable with a structural stop. The stop belongs beyond the sweep low (the 100% level plus a buffer), so an entry at 50% risks half the leg to make half the leg back to the high: 1 : 1. An entry at 70.5% risks about 30% of the leg to make 70% back to the high, roughly 2.3 : 1 to the first target alone, and more to the liquidity beyond it. The deeper entry is better priced and better protected, and the band's deep edge at 79% is where the price is best without the leg having failed.
Reward-to-risk arithmetic
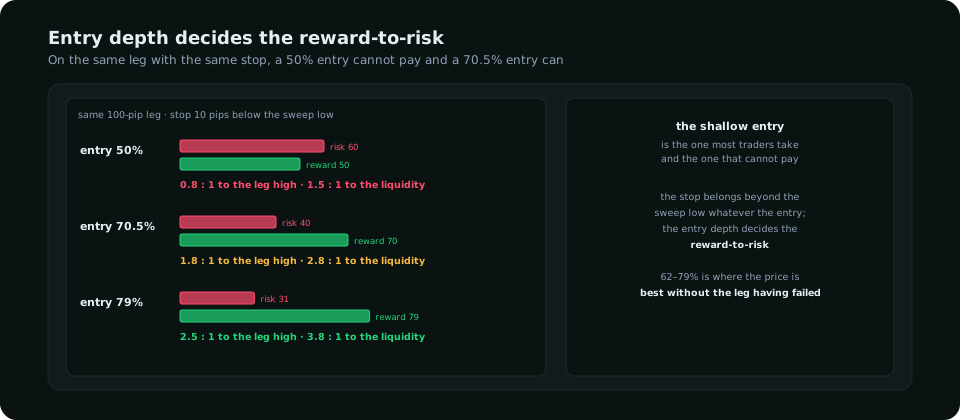
Take a 100-pip leg from a sweep low at 1.0800 to a structure-breaking high at 1.0900, stop at 1.0790. A trader entering at 50% (1.0850) risks 60 pips to make 50 to the high: 0.8 : 1, a losing proposition at any realistic win rate. At 70.5% (1.0830) the risk is 40 pips and the reward to the high 70: 1.8 : 1, or 2.8 : 1 to the liquidity 40 pips above the high. At 79% (1.0821) it is 2.5 : 1 to the high. The OTE is not about precision; it is about refusing the shallow entry that the impatient trader takes and that the arithmetic says cannot work. The reward-to-risk guide shows what those ratios mean for the win rate the setup needs.
Confirmation, or the limit order
Two ways to take the entry. A limit order at 70.5% with the stop beyond the sweep low catches every pullback that reaches the zone, including the ones that run straight through it; it is the higher-frequency, lower-win-rate version. A confirmed entry waits for price to enter the band and then for a lower-timeframe rejection (a one- or five-minute close back up out of the band, or a small break of structure on that timeframe) before entering, usually a little above 70.5%; it misses the pullbacks that touch 62% and leave, and avoids the ones that fail. Most traders should start with the confirmed version and move to limits only once a log shows the zone holds often enough to justify them. In either case the stop is beyond the 100% anchor, never inside the band: a stop at 79% is a stop at the deep edge of the zone the trade is built around.
Where OTE fits in the sequence
OTE is an entry refinement, the fourth step of five. The ICT trading guide lays out the order: a daily bias, liquidity swept against it, a market structure shift with displacement, and then the pullback into the OTE inside a kill zone. The fibonacci drawn on a leg that did not sweep liquidity or break structure is drawn on a leg that has no reason to hold. Used in sequence, OTE is a way of being patient with a setup already validated; used alone, it is a fibonacci tool with extra names.
When it fails
- The leg broke no structure. A bounce that stayed below the last lower high is not a displacement leg; its 70.5% is a random price. Check the break before drawing.
- Price closes through 79%. A wick into 85% that closes back above 79% is a sweep of the zone and often the best entry of all; a close below 79% on the entry timeframe means the leg is failing and the trade is skipped, whatever the limit order would have done.
- The pullback arrives outside a kill zone or into a release. A retracement that reaches the band in the London lunch lull or ten minutes before a red release has no participants to turn it. The calendar guide covers the windows to avoid.
Frequently asked
What is optimal trade entry in ICT?
The 62–79% retracement of a displacement leg that swept liquidity and broke structure, with the stop beyond the leg's origin. The order block and fair value gap that started the leg usually sit inside the band, which is why it is the entry zone.
Where do you draw the fibonacci for OTE?
From the sweep's extreme (100%) to the high or low of the leg at the point it broke structure (0%). The leg must contain the structure break; a fibonacci on a bounce that did not is not an OTE.
Is OTE better than entering at 50%?
With a structural stop beyond the leg's origin, yes by arithmetic: a 50% entry risks more than it can make to the leg's high, a 70.5% entry risks about half as much for a larger target. The deeper entry is missed more often and pays when it fills.
Everything on SMC Terminal is analysis and education, not a recommendation to buy or sell. Figures in the example are illustrative. Trading carries a substantial risk of loss. Manage your risk.