Gold Swept $4,083 and Then $4,030: An SMC Read of the Move That Ended at a One-Year Low
In the last week of October 2026 gold took liquidity on both sides of its range: a spike to $4,083 on Fed day that was rejected at once, then a dip under $4,030 that swept the recent lows. Between them sat a bearish order block at $4,075–4,083, a bullish fair value gap at $4,040–4,048 and a demand zone at $3,985–3,992 where the whole rally had started. This guide walks through that chart read concept by concept, shows where the liquidity actually led (through demand to $3,875 on 30 October and a one-year low of $3,852 on 12 November), and redraws the map for what is left.
Written on 14 November 2026. The chart read describes gold between 27 and 30 October; the outcome runs to the 13 November close near $3,888.
Every so often a gold chart gives a clean lesson in how liquidity works, and the last week of October 2026 was one. In three sessions XAU/USD ran the highs of its range, ran the lows of its range, and left every Smart Money Concepts landmark a trader could ask for: a buy-side liquidity sweep at $4,083 that was rejected within the hour, a bearish order block at $4,075–4,083 at the origin of the drop, a sell-side sweep under $4,030, a bullish fair value gap at $4,040–4,048 overhead, and a demand zone at $3,985–3,992 where the autumn rally had begun. On 29 October the honest question was "where does the liquidity lead next?" This guide answers it with the benefit of two weeks: through the demand zone on 30 October, down 3.6% to $3,875, and on to a one-year low of $3,852 on 12 November. It walks the original read concept by concept, explains why the bearish side won, and redraws the map for what is left. The gold structure guide covers the method; this piece applies it to one week that mattered.
The chart on 29 October
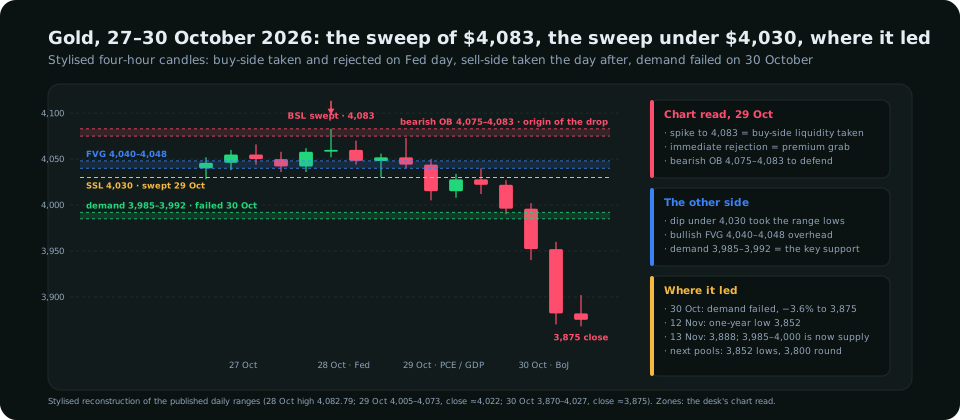
| Landmark | Level | What it was | What a trader does with it |
|---|---|---|---|
| Buy-side liquidity taken | $4,083 (28 Oct high, 4,082.79) | The spike above the range highs during the Fed press conference, rejected immediately | A textbook grab into premium: stops above the highs were the target, not the destination |
| Bearish order block | $4,075–4,083 | The last up-candle before the displacement down; the origin of the move | The zone sellers defend on any retrace; a short entry with a stop above 4,083 |
| Sell-side liquidity swept | Under $4,030 | The dip on 29 October that took the lows of the recent range and reacted at once | Both sides now cleared; the next move is the real one |
| Bullish fair value gap | $4,040–4,048 | The imbalance left by the drop, sitting just above price | The first obstacle any bounce has to fill and hold |
| Demand | $3,985–3,992 (bullish OB inside) | Where the autumn rally started | The key support; a long from it with a stop under 3,980, or the line that turns the read bearish if it fails |
Each of those is a defined thing, not a feeling. The liquidity guide covers where resting orders sit and why price is drawn to them; the order block guide and the fair value gap guide cover how each zone is marked and confirmed; and the liquidity grab guide explains the test that separated the $4,083 spike from a breakout: no acceptance above the level, no displacement candle in the direction of the break, and an immediate return into the range.
Two sweeps, one question
When a market takes liquidity on both sides of a range within two sessions, the range is finished and the next directional move will be the one that matters. The read on 29 October had to answer which side would win, and the chart offered three pieces of evidence:
- Displacement. The drop from $4,083 was fast and left an imbalance (the fair value gap); the bounce from under $4,030 was slow and left none. Displacement marks the side with the orders behind it, and it was the sellers'.
- Premium and discount. Using the range from the $3,985 demand to the $4,083 high, the midpoint sat near $4,034. Price under $4,030 was in discount, which is where longs are supposed to be taken; but the structure above was a stack of unmitigated supply, which is what the premium–discount guide warns about: discount inside a bearish structure is a place to cover shorts, not to initiate longs.
- The macro side. The Fed had just upgraded growth to "strong" and kept inflation "elevated", the 10-year was back above 5%, and the September PCE and third-quarter GDP data due at 12:30 UTC on 29 October were expected hot. Gold's chart was asking a macro question, and the why-gold-is-falling guide had set out the answer a fortnight earlier.
The conclusion on the day was: the bias is down, the demand at $3,985–3,992 is the line, and the trade is to sell a bounce into the fair value gap or the order block rather than to buy the discount. A long from demand was permitted only with a stop beneath it and a target no further than the gap.
Where the liquidity led
| Date | Range and close | What happened | Which landmark it answered |
|---|---|---|---|
| 29 Oct | 4,005–4,073, close ≈4,022 | Core PCE 3.1% y/y and GDP 3.4% at 12:30 UTC; gold sold from the gap, tested just above demand and bounced | Demand held its first test; the FVG rejected the bounce |
| 30 Oct | 3,870–4,027, close ≈3,875 (−3.6%) | Bank of Japan hold, December Fed hike bets firm, silver through $50; gold opened under the gap and never looked back | Demand failed on the second test; the range's origin became supply |
| 3–11 Nov | 3,880–3,990 | Rallies stalled under the failed demand zone and the $4,000 round number; payrolls on 6 November added to the dollar | Old demand confirmed as new supply |
| 12 Nov | Low 3,852.14, close ≈3,885 | Hot October CPI the day before, dollar index at a nineteen-month high, oil higher on fading peace hopes; the drop ran stops under two weeks of bullish positions | The next sell-side pool below the range |
| 13 Nov | ≈3,888 | A flat day after a producer-price report that changed nothing | Price between the new low and the new supply |
The read's first half, the bearish bias, was right. Its specific long idea, a bounce from $3,985 toward the gap, was available for one session and then invalidated. That is a normal outcome, and the way the demand failed is the useful part: not on a slow drift but on a gap lower at the open of 30 October, the signature of a zone whose buyers have already been used up. The supply and demand guide describes the rule: a demand zone is good for one clean test; the second, especially after a failed bounce, usually breaks.
The redrawn map
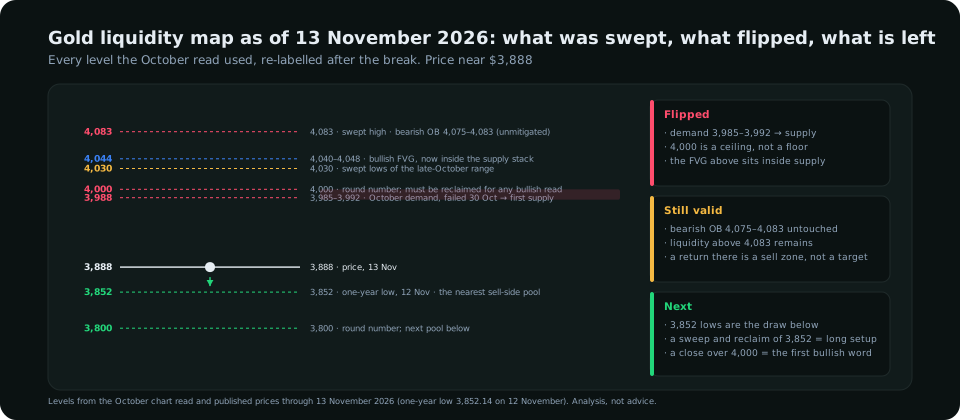
- Flipped. The $3,985–3,992 demand zone is now the first supply, with the $4,000 round number inside the same stack. No bullish read exists until price closes above $4,000 and holds it on a retest.
- Still valid. The bearish order block at $4,075–4,083 has never been mitigated. If gold rallies that far it is a sell zone, not a target, until the order block is traded through with displacement.
- The draw below. The one-year low at $3,852 is the nearest pool of sell-side liquidity: stops under a low that every participant can see. A sweep of it followed by a reclaim, with a displacement candle back above $3,870, is the first long setup the chart has offered since the autumn. A clean break with acceptance below points to the $3,800 round number.
Three lessons from the week
- After a two-sided sweep, trade the side with displacement. Both sides were cleared; only one was cleared with speed and an imbalance. That side won by $230.
- Discount is a condition, not a signal. Price under $4,030 was in the discount half of the range and inside a bearish structure. The structure outranked the arithmetic.
- Zones have a shelf life. Demand that has produced one rally and one bounce has spent its orders. The failure on the second test was not bad luck; it was the base case.
Sizing follows the risk management rules and gold's current average true range, which has widened sharply since October; a stop that was adequate at $20 in September needs $40 or more now. The daily-bias guide covers the routine for setting the direction before each session.
What to read in the terminal
The desk's own gold charts, with zones, invalidation and targets, are published on the Technical Analysis page as the structure changes; the October read above is the kind of map they carry. Inside the terminal, Symbol Analysis for XAU/USD combines the chart with the reads a chart cannot show: the managed-money position from the CFTC report (long and being liquidated, which is what the 12 November stop run looked like in positioning terms), the ten-year seasonal curve (November to January is historically gold's stronger stretch, which the seasonality guide explains is a tailwind, not a trigger), and the real-yield and dollar reads that have driven the fall. Those are part of every plan on the pricing page.
Frequently asked
What is a liquidity sweep in gold trading?
A move that pushes just beyond an obvious high or low, triggers the stop orders resting there, and then reverses. Gold's spike to $4,083 on 28 October 2026 swept the buy-side liquidity above the range highs and was rejected immediately; the dip under $4,030 the next day swept the sell-side.
What is a bearish order block and where was gold's?
The last up-candle before a fast move down, treated as the zone where the sellers' orders originated and where they will defend on a retest. Gold's sat at $4,075–4,083, the origin of the drop from the Fed-day high, and it remains unmitigated as of 13 November.
Why did the $3,985–3,992 demand zone fail?
It had already produced the autumn rally and one bounce on 29 October, so its orders were largely spent; the bias above it was bearish with displacement to the downside; and the macro drivers (a Fed upgrading growth, a 10-year yield above 5%, a rising dollar) were all against it. It broke on a gap lower on 30 October, and the zone is now the first supply.
Where does gold's liquidity lead next?
Below, to the one-year low at $3,852 set on 12 November, the nearest pool of resting sell stops; a sweep and reclaim there is the first long setup, a clean break points to $3,800. Above, $3,985–4,000 is supply and the $4,075–4,083 order block is a sell zone until it is traded through.
Everything on SMC Terminal is analysis and education, not a recommendation to buy or sell. Levels are from published prices through 13 November 2026 and the desk's own chart read; they change continuously. Trading carries a substantial risk of loss. Manage your risk.