Bitcoin Under $68,000: How a $64 Billion Anthropic IPO, Seven Days of ETF Outflows and an MSCI Decision Drained the Bid
Bitcoin fell through $68,000 on 13 November 2026 and traded as low as $65,626 the next morning, its weakest since August and a sixth straight weekly loss. The explanation doing the rounds is liquidity: Anthropic prices the second-largest IPO in history on 18 November, raising about $64 billion at $70–78 a share with the book six times covered, and investors are said to be selling what they can sell to fund allocations. Spot bitcoin ETFs have lost about $1.91 billion over seven sessions, MSCI will remove Strategy from its indexes on 30 November, and the Fed's December hike is fully priced. This guide weighs each factor, tests the SpaceX-IPO analogy from June, and sets out the levels that matter.
Written on 14 November 2026. Prices and flow figures are from published reports through the morning of 14 November.
The bitcoin price broke below $68,000 on 13 November 2026 and kept going, trading at $65,626 by the following morning, its lowest since August and the sixth consecutive weekly decline. For a market that spent the summer above $75,000 that is a drawdown of close to a fifth, and the explanation that has stuck is not about bitcoin at all. Anthropic, the AI company, prices its initial public offering on 18 November and lists on Nasdaq on 19 November under the ticker ANT, raising about $64 billion at $70 to $78 a share for 825 million shares, with a further $26 billion or so going to strategic buyers including Microsoft, Nvidia, Alphabet and Micron. It is the second-largest IPO in history after SpaceX's in June, the book is reported to be covered about six times, and a fifth of the offering is reserved for retail investors. The argument, made most directly by Xapo Bank's chief executive Seamus Rocca, is that investors who want an allocation are raising cash by selling the most liquid thing they own, and for a certain kind of investor that is bitcoin. It is a plausible story. It is also, as several analysts cautioned, not the whole one: spot bitcoin ETFs have recorded about $1.91 billion of outflows across seven straight sessions since 5 November, MSCI has decided to remove the bitcoin-treasury company Strategy from its indexes on 30 November, Nvidia's turmoil has hit every expression of the AI trade, and the Federal Reserve is a fully priced hike away from raising the return on cash again. This guide weighs each factor, tests the June SpaceX analogy that bulls are leaning on, and sets out the levels that matter. The yields guide covers the rate backdrop that every risk asset is now trading against.
The flows competing with bitcoin
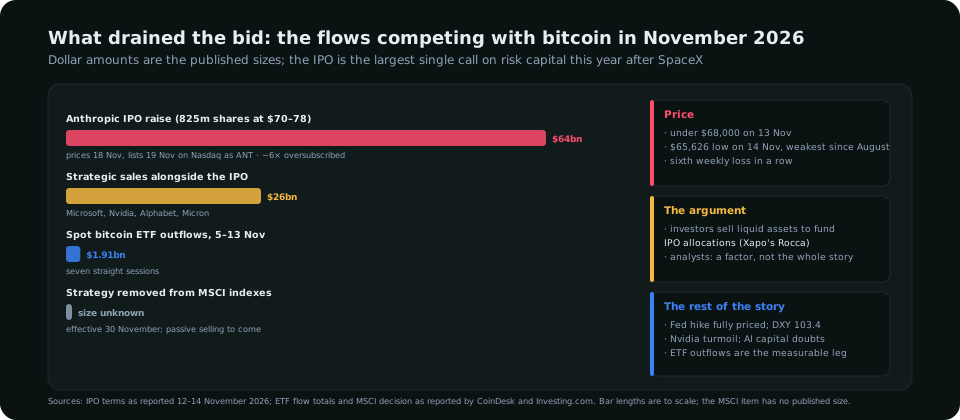
| Factor | Size and timing | How it reaches the bitcoin price | Weight |
|---|---|---|---|
| Anthropic IPO | ≈$64 billion at $70–78; prices 18 Nov, lists 19 Nov; ≈6× covered; 20% retail | Investors sell liquid assets to fund allocations; the demand is for dollars this week, not next | Real but temporary; it ends the day the shares trade |
| Strategic sales | ≈$26 billion to Microsoft, Nvidia, Alphabet, Micron | Corporate cash, not market liquidity; little direct effect | Small |
| Spot ETF outflows | ≈$1.91 billion over seven sessions from 5 Nov | Direct selling of coins held by the funds; the one flow that is measured daily | The largest measurable leg |
| MSCI removes Strategy | Effective 30 Nov | Passive funds must sell the shares; the company's bitcoin is not sold, but the equity bid for "bitcoin exposure" shrinks | Medium; mostly ahead |
| Fed and the dollar | December hike fully priced; DXY 103.4, highest since April 2025 | A higher return on cash and a stronger dollar lower the appeal of a non-yielding asset, exactly as with gold | The backdrop that makes the others bite |
| Nvidia and the AI trade | CEO exit 12 Nov; −12.75% on the week | Risk-off across everything correlated with technology; bitcoin has traded as a high-beta Nasdaq proxy all year | Medium |
Ranked honestly: the ETF outflows are the only factor with a daily number attached and they are the largest direct seller; the IPO is the story that explains why the outflows started when they did; and the Fed is the reason buyers are not stepping in at prices that would have looked cheap in September. Gold, which pays nothing either, fell to a one-year low in the same week on the same rates logic; the gold guide reads that move from the chart and the two assets are now answering to the same force.
The SpaceX analogy, tested
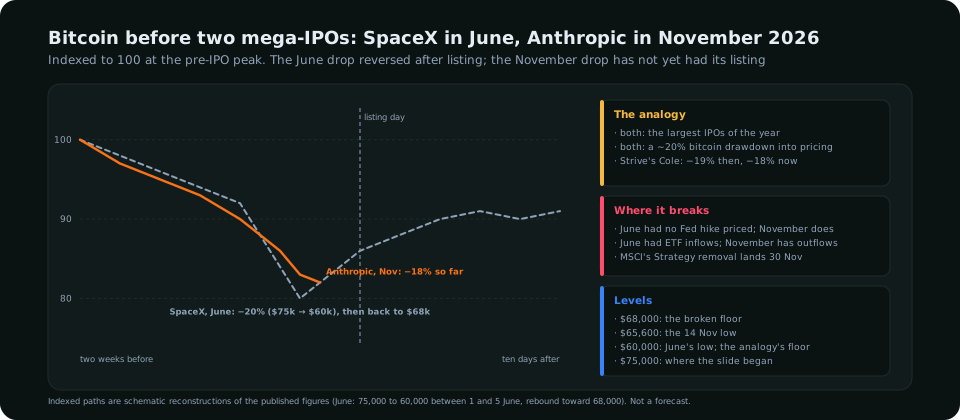
Bulls point to June. In the five days before SpaceX's IPO bitcoin fell roughly 20%, from about $75,000 to $60,000, and then recovered toward $68,000 once the shares were trading and the cash call was over. Strive's chief executive Matt Cole has put numbers on it: down 19% before SpaceX, down about 18% before Anthropic. The pattern fits, and if the IPO really is the marginal seller then the selling has a date on which it stops. Three things make the analogy weaker than it looks:
- June had no Fed hike priced. The June drawdown happened with the Fed on hold and the dollar index near 100. November's happens with a hike fully priced, a half-point discussed, and the dollar at a 19-month high. The cash that was raised in June went back into risk; the cash raised now earns 4% and may stay there.
- June had ETF inflows. The funds were buyers through the SpaceX drawdown, which cushioned it. In November they have been sellers for seven straight sessions. Until that series turns, the floor the analogy promises has no buyer under it.
- The MSCI decision lands after the IPO. Whatever relief 19 November brings, 30 November brings forced selling of the largest corporate holder's shares. The June recovery had no second event in its way.
The honest version of the analogy is this: the IPO explains the timing of the drop and gives a date for the end of one source of selling; it does not say the price has to recover, and the two factors it does not account for are both negative.
Levels
| Level | What it is | Read |
|---|---|---|
| $75,000 | Where the slide began; the summer range | Not in play before the IPO and the MSCI date have passed |
| $70,000 | Round number | The first level a relief rally after 19 November would have to reclaim |
| $68,000 | Broken on 13 November; June's post-IPO recovery level | Resistance now; a daily close back above it is the first sign the IPO selling is finished |
| $65,626 | 14 November low; lowest since August | The reference low; a sweep and reclaim is the first long setup the chart offers |
| $60,000 | June's low; round number | The analogy's floor and the obvious pool of resting stops |
The structure is the same one the liquidity sweep guide describes in any market: a run of lower lows with the obvious stops under each, and a reversal that, when it comes, usually begins with a sweep of the last low rather than a bounce above it. $65,600 and $60,000 are the two pools.
What would change the read
- ETF flows turning positive for two or three sessions. It is the one daily series that measures the marginal buyer, and it has been negative since 5 November.
- A clean Anthropic debut on 19 November. A strong first day confirms the AI trade still has capital behind it and removes the cash call; a weak one confirms the fatigue and would hit bitcoin through the Nasdaq correlation as well.
- The dollar losing 103. Bitcoin has traded inversely to the dollar index for most of the year; a DXY reversal would lift it before any crypto-specific news did. The dollar index guide covers the levels.
- A dovish December path. The hike itself is priced; a projection that shows December as the last move would lower the return on cash that is currently winning the comparison.
For forex and gold traders
Bitcoin matters to this site's readers as a risk gauge rather than as an instrument. Its six-week slide, gold's fall to a one-year low, the Nasdaq's week and AUD/USD's nine-month low are one move in four markets, and the common factor is a Fed that is hiking into a strong economy with a strong dollar. When bitcoin and gold fall together, the driver is real yields, not either asset's own story; when they diverge, the crypto-specific factors above are doing the work. The terminal's macro-regime panel scores risk appetite from the dollar, yields and equities, and it has read risk-off since 12 November; the risk management rules apply with more force in a week when every correlated market is moving the same way, because the diversification a trader thinks they have is smaller than it looks.
What to read in the terminal
The intermarket read in Symbol Analysis shows each pair's correlation with the Nasdaq 100 and the dollar index, which is where bitcoin's week shows up for a currency trader: AUD/USD and USD/JPY carry the risk signal, and both have been moving with it. The macro-regime panel's risk score and the Valuation and Yields read on real rates are the two inputs that explain gold and bitcoin falling together; both are part of every plan on the pricing page.
Frequently asked
Why did bitcoin fall below $68,000 in November 2026?
A combination of the $64 billion Anthropic IPO drawing cash from liquid assets ahead of its 18 November pricing, about $1.91 billion of spot ETF outflows over seven straight sessions, MSCI's decision to remove Strategy from its indexes on 30 November, Nvidia-led risk aversion and a fully priced Fed hike that raises the return on cash. Bitcoin traded as low as $65,626 on 14 November, its weakest since August.
Is the Anthropic IPO really draining crypto liquidity?
Partly. Investors seeking allocations in a six-times-covered offering have an incentive to raise cash from liquid holdings, and the timing of the ETF outflows fits. But analysts caution against attributing the whole decline to it; the ETF outflows, the MSCI decision and the rate backdrop are independent sellers.
What happened to bitcoin around the SpaceX IPO?
It fell about 20%, from roughly $75,000 to $60,000, in the five days before SpaceX's June 2026 listing and recovered toward $68,000 once the shares were trading. The November decline is about 18% so far, but the backdrop differs: a Fed hike is priced, ETFs are selling rather than buying, and the MSCI removal follows the IPO.
What are the key bitcoin levels to watch?
$68,000 as resistance, $65,626 as the current low, $60,000 as June's low and the next pool of stops, and $70,000 then $75,000 as the levels a recovery would need to reclaim.
Everything on SMC Terminal is analysis and education, not a recommendation to buy or sell. Prices and flow figures are from published reports through 14 November 2026 and change continuously. Trading carries a substantial risk of loss. Manage your risk.