Gold Technical Analysis: How to Read XAUUSD Market Structure
Gold moves differently from a currency pair — larger ranges, sharper sweeps, and a habit of trending for months. This guide is gold technical analysis built on market structure: how to mark swings on XAUUSD, read breaks of structure and changes of character across the daily, 4-hour and hourly charts, and turn that into a bias with a level, a target and an invalidation.
Gold is the most traded metal in the world and, for most retail traders, the most expensive one to learn on. A 4-hour candle on XAUUSD can cover what EUR/USD covers in a week. Sweeps go further, pullbacks are deeper, and the trend, once it starts, tends to run for months. The good news is that gold respects market structure as cleanly as any instrument — the swings are just bigger. This guide is gold technical analysis built around that structure, from marking the swings to producing a bias you could actually trade.
Why gold needs its own technical approach
| Characteristic | XAUUSD | EUR/USD (for comparison) | Consequence |
|---|---|---|---|
| Typical daily range (ATR 14) | $35–60, around 1–1.5% of price | 60–90 pips, around 0.6–0.8% | Stops must be in ATR, not in a fixed dollar amount |
| Session character | Quiet in Asia, explosive at the London and New York opens | More evenly spread | Most tradeable structure forms in two windows a day |
| Sweep depth | Routinely 0.5–1 ATR beyond a level | Often a few pips | Stops on the level itself get taken constantly |
| Trend persistence | Multi-month trends with 10–15% corrections | Shorter, more range-bound | The daily chart carries more weight in the bias |
| Drivers | Real yields, the dollar, central-bank demand, risk sentiment | Rate differentials, risk sentiment | Structure needs to be read against the macro drivers, not alone |
Step one: mark the swings honestly
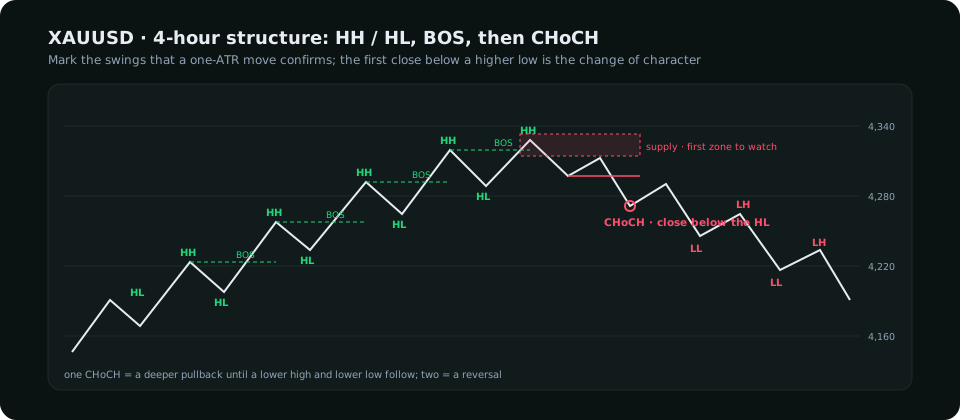
Market structure begins with swing highs and swing lows, and the most common error is marking too many. A usable rule on gold: a swing high is a candle whose high is above the highs of the two candles on either side, and which is followed by a move of at least one ATR away from it. The second condition removes the noise that gold produces inside a single session. Mark them on the daily first, then the 4-hour, then the hourly — three separate sets.
Step two: break of structure versus change of character
With swings marked, the chart reads itself:
- Break of structure (BOS) — in an uptrend, a close above the previous swing high. The trend is confirmed as continuing. The pullback that follows into the last higher low, or into the demand zone that produced the break, is the trend-following entry.
- Change of character (CHoCH) — in an uptrend, the first close below the most recent higher low. It does not mean the trend has reversed; it means the sequence has been interrupted and the next move needs to prove itself. Two consecutive lower highs and lower lows after a CHoCH is a reversal; one is a deeper pullback.
On gold, insist on the close. A wick below a higher low on the 4-hour chart is a sweep of that low's liquidity until the candle closes — and gold sweeps 4-hour lows on an ordinary Tuesday. The close is where the information is. The market-structure method describes how the sweep and the shift combine into an entry.
Step three: the three-timeframe ladder
Gold's structure has to be read on three timeframes with distinct jobs, or the signals contradict each other.
| Timeframe | Job | What you take from it |
|---|---|---|
| Daily | The trend and the big levels | Direction of the bias; the swing high and low that define the current range; previous weekly high and low |
| 4-hour | The pullback and the zones | Whether price is pulling back or reversing; the supply and demand zones that produced the last breaks; the 4-hour structure that must hold |
| Hourly | Timing | The sweep, the shift and the retest inside the 4-hour zone; the stop and the first target |
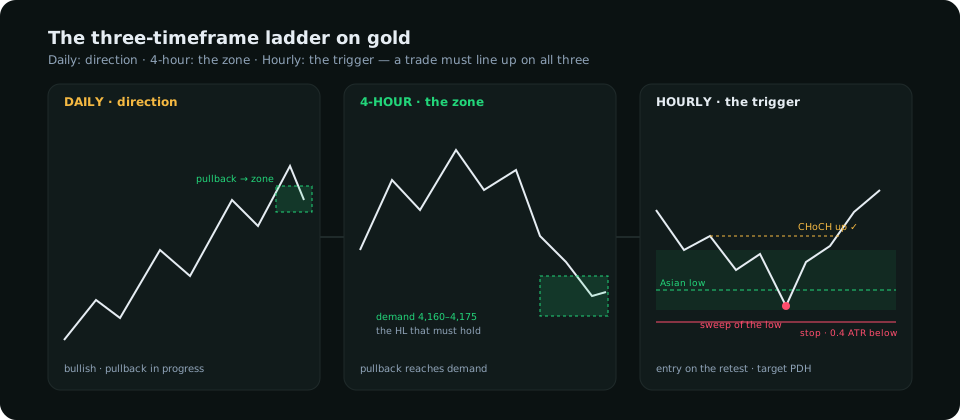
The rule that follows: trade the hourly only in the daily's direction, and only inside a 4-hour zone. An hourly change of character upward that happens in the middle of nowhere on the 4-hour chart is noise. The same shift at a 4-hour demand zone, with the daily trend up, is the trade.
Where gold's liquidity sits
Because gold sweeps so routinely, knowing where the resting orders are is half of reading its structure. The reliable pools:
- Asia's high and low. Gold's Asian range is usually narrow; London takes one side of it most days and often the other side too before the real move.
- The previous day's high and low. Gold revisits one of them on the majority of days.
- Round numbers in $50 steps — 4,200, 4,250 — and the $100 levels, which attract both stops and option-related interest.
- Equal highs and lows on the 4-hour chart, which on gold tend to be swept by a wider margin than on currencies: give them 0.4 ATR of room before deciding the sweep has failed.
The liquidity-sweep tutorial covers validation; the point here is that on gold the stop must sit beyond the sweep's expected reach, which means roughly half an hourly ATR beyond the pool, not on it.
Step four: ATR-based stops and targets
Fixed-dollar stops on gold are a slow way to lose. A $10 stop that was fine when the daily ATR was $25 gets hit by noise when the ATR is $55. Size everything in ATR:
| Element | Rule of thumb on XAUUSD |
|---|---|
| Stop on an hourly entry | Beyond the structure or sweep + 0.3–0.5 hourly ATR |
| Stop on a 4-hour entry | Beyond the zone + 0.5 4-hour ATR |
| First target | The nearest opposing liquidity pool (previous day's high / low, equal highs / lows) |
| Second target | The daily swing in the direction of the bias |
| Position size | From the stop distance — see the position size calculator |
Step five: structure against the drivers
Technical structure tells you what price has done. On gold, three things outside the chart decide whether it continues: real yields (gold falls when inflation-adjusted yields rise), the dollar (usually inverse, not always), and positioning (speculators near a record net long leave less fuel for the next leg). A bullish 4-hour structure with real yields rising and the dollar bid is a structure that is likely to get a CHoCH soon. The same structure with yields falling, the dollar weak and positioning moderate is one to trust. Traders who read gold from the chart alone are reading half the instrument; a dashboard that puts the drivers beside the structure (the research reads) is one way to see both, and a yields chart plus the CFTC's weekly report is another.
Turning it into a bias
A finished piece of gold analysis is short. It names the daily direction, the 4-hour zone that must hold, the hourly trigger that would confirm an entry, the level that invalidates the idea, and the targets — with the drivers either supporting or arguing against. Something like: "Daily bullish; 4-hour pullback into demand at 4,160–4,175; wait for an hourly sweep of the Asian low and a close back above 4,168; stop 4,152; targets 4,212 then 4,238; real yields softening and the dollar flat support it; speculators are at the 88th percentile of their net long, so size moderately."
That is one paragraph, and it is complete. Anything longer is usually a chart with too many swings marked.
Everything on SMC Terminal is analysis and education, not a recommendation to buy or sell. Prices and ranges are illustrative. Trading carries a substantial risk of loss. Manage your risk.