Why Gold Is Falling in October 2026: Below $4,000 After a $5,400 Record
Gold touched a three-month low of $3,975 on 23 October 2026 and closed its worst week in over four months, down about 4%, having set its record close near $5,405 in January. 'Why is gold falling' is the most searched gold question this week, and the answer is not one thing: oil above $110 lifted inflation expectations, that kept a December Fed hike priced and Treasury yields near 5%, the dollar firmed, and a tech selloff added forced selling. This guide sets out the drivers, what is still supporting the metal, the levels, and how to trade a pullback inside a bull market.
Written on 27 October 2026. Levels are from the 23 October close and the 26 October session.
Why is gold falling? It is the most searched gold question of the week, and it deserves a precise answer because the lazy one, "the dollar is up", is only a quarter of it. Gold touched a three-month low of $3,975 on Friday 23 October 2026 and finished the week near $4,010, down about 4% and its worst week in over four months. The metal set its record close near $5,405 in January and has given back roughly a quarter of that since. Four forces pushed it down last week, all of them connected to one commodity, and two forces are still holding it up. This guide sets out both sides, the levels the market is trading, and how to approach a pullback of this size inside what is still, on the yearly chart, a bull market. The 24 October technical analysis covers the chart; this piece covers the why.
The path from the record
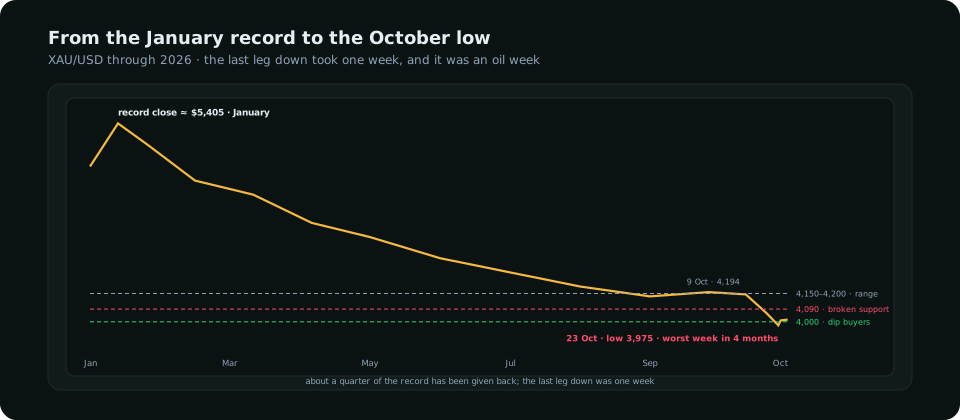
| Date | Level | What happened |
|---|---|---|
| January 2026 | About $5,405 | Record close |
| 9 October | $4,194 | Last close in the autumn range before the slide |
| 14 October | Range breaks | Hot US CPI and the dollar's 2026 high against the euro |
| 23 October | $3,975 low, $4,010 close | Brent at a six-month high; worst week in four months |
| 26 October | About $4,013–4,016 | Stabilising ahead of the Fed, dip buyers at $4,000 |
The four forces pushing it down
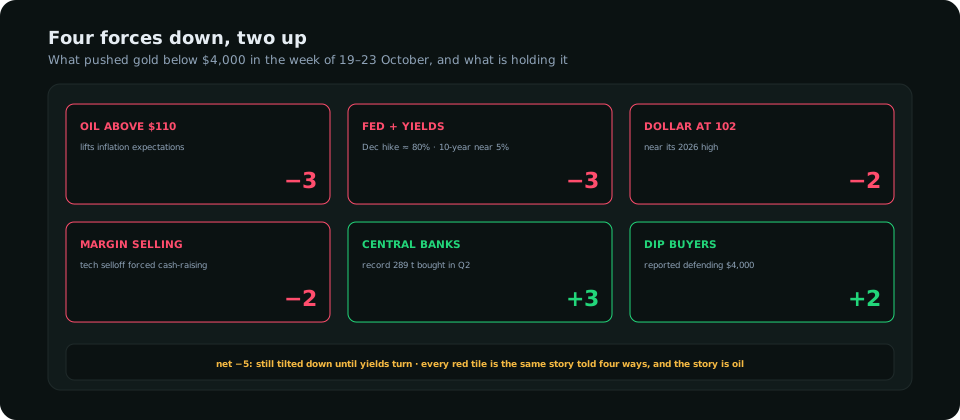
Oil and inflation expectations. Brent rose through $110 and closed the week at $116.72 after attacks on Saudi energy infrastructure. Higher energy prices lift inflation expectations immediately, and gold's relationship with inflation is not the simple one in the textbooks: gold rises when inflation is expected to erode real rates, and falls when inflation is expected to make the central bank hike. In October the second reading won. The oil shock guide traces the chain.
The Fed and real yields. The market priced a December hike at about 78–90% and the ten-year Treasury yield reached about 5%, the highest of the cycle. Gold pays nothing, so a 5% nominal yield with inflation near 3.7% is a positive real return of over a point, which is exactly the environment gold struggles in. The real yields guide explains why this is the variable that matters most. The Fed decision guide covers Wednesday's meeting, which is where the real-yield story gets confirmed or denied.
The dollar. The dollar index was at about 102 on 26 October, near its 2026 high, with EUR/USD at a 2026 low of 1.1113 on 14 October. A firmer dollar raises the price of gold in every other currency and dents demand at the margin. This is the smallest of the four forces this month; the DXY and gold guide explains why the correlation is loose.
Forced selling. A selloff in technology stocks produced margin calls, and gold is the liquid asset funds sell to meet them. This is the force that produced the $3,975 wick: it is mechanical, it is temporary, and it is why the metal recovered $35 from the low by the close.
The two forces holding it up
Central banks bought a record 289 tonnes in the second quarter of 2026, and that buying is not price-sensitive in the way fund flows are; it is a reserve-diversification decision that continues through drawdowns. And the market has reported dip buyers defending $4,000, which is both a round number and roughly where the autumn range's measured move completes. Neither force reverses the trend on its own. They set a floor under which the sellers have to work much harder, and they are why a 4% week produced a $3,975 low rather than a $3,800 one.
Levels and how to trade the pullback
| Level | Meaning | Use |
|---|---|---|
| $4,150–4,200 | The former range and the 9 October close at $4,194 | Resistance; a daily close back above it ends the pullback |
| $4,090 | Support that broke on 23 October | First resistance on a bounce; the level a retest would fail at if the trend down continues |
| $4,000 | Round number, reported dip-buying zone | The line the bulls are defending; a daily close below it opens $3,940 |
| $3,975 | 23 October low | The sweep target below $4,000 and the stop reference for a long |
| $3,940 | Daily demand from the 24 October analysis | Where a deeper pullback meets the next structural buyers |
A pullback inside a bull market is traded one of two ways, and the choice is about timeframe. The swing trader waits for the daily chart to put in a higher low above $3,940 and a close back above $4,090, then buys the retest with a stop below the low; that is a trade that needs the Fed and the oil market to stop pushing, and it may not set up this week. The day trader treats the $3,975–4,000 area as a liquidity pool: a sweep of it in the London or New York session followed by a close back above $4,000 with displacement is a long with a stop beneath the wick, targeting $4,090. The gold day trading guide sets out that plan. Shorts from $4,090 into a failed retest are the trend trade, and they stop above $4,150. In both directions, Wednesday's Fed decision moves gold $30–100 in minutes, and the daily bias guide explains why the plan should be written before the session, not during it.
What to read in the terminal
The Valuation module tracks gold against real yields and the dollar and shows whether the metal is cheap or expensive relative to those drivers; after a 4% week on a 5% yield it reads closer to fair than it has since the spring. The Positioning dashboard shows the speculative gold long, which has been reduced but not flushed; the gold COT guide explains why a pullback that leaves the long intact is not finished, and one that flushes it usually is.
Frequently asked
Why is gold going down when there is a war?
Because the war has reached gold through oil and interest rates rather than through fear. Oil above $110 lifts inflation expectations, which keeps the Fed hiking and Treasury yields near 5%, and a 5% risk-free yield is the strongest competitor gold has. The fear bid exists, but in October the yield effect was larger.
Is $4,000 gold a buying opportunity?
The level has reported dip buyers and a record central bank bid beneath it, and the metal is a quarter below its January record. Whether it is an opportunity for you depends on timeframe: a swing long needs the daily chart to confirm with a higher low and a close back above $4,090; an intraday long needs a sweep of $3,975–4,000 and a close back above it. Buying a round number because it is round is not a plan.
What would make gold fall further?
A hawkish Fed on 28 October that lifts December to near-certainty and pushes the ten-year through 5%, or oil breaking above $120 on a new attack. Either would likely take gold through $3,975 toward $3,940 and, on a daily close below that, $3,800.
Everything on SMC Terminal is analysis and education, not a recommendation to buy or sell. Prices are as of 23–26 October 2026 and change continuously. Trading carries a substantial risk of loss. Manage your risk.