Forex Risk Management: Position Sizing, Stops and Exposure
Most traders who fail were right about direction often enough to survive. They failed on size. This guide is the arithmetic of staying in the game — the position-size formula with worked examples, where a stop has to sit to be real, correlated exposure, and the daily limit that stops a bad hour becoming a bad month.
Here is the only statistic in trading that is both true and useful: a trader risking 1% per trade can be wrong twenty times in a row and still have 82% of the account. A trader risking 10% per trade is at 12% after the same run. Both traders had the same edge. One of them is still trading.
Risk management is not a mindset. It is arithmetic done before every trade and a few rules that stop you from skipping the arithmetic when you are angry. This guide is that arithmetic, with the numbers filled in.
The position-size formula
Decide the money you will lose if the trade fails, decide where the stop has to be for the idea to be wrong, and the size follows:
Position size = Risk amount ÷ (Stop distance × Value per pip per lot)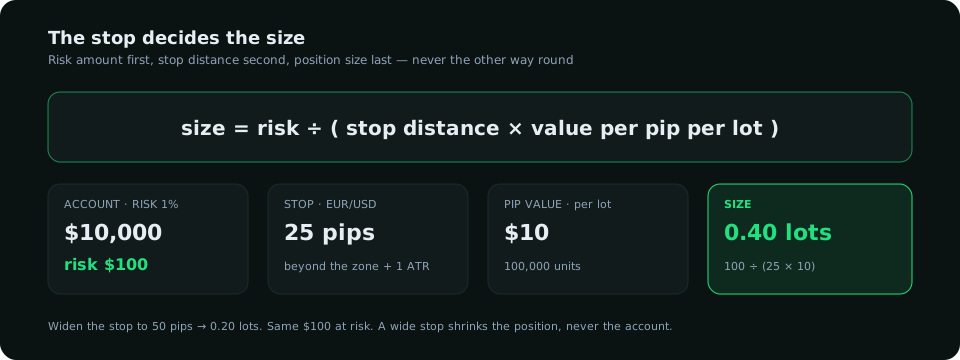
| Account | Risk (1%) | Pair | Stop | Pip value / lot | Size |
|---|---|---|---|---|---|
| $10,000 | $100 | EUR/USD | 25 pips | $10 | 0.40 lots |
| $10,000 | $100 | GBP/JPY | 60 pips | ≈ $6.7 | 0.25 lots |
| $10,000 | $100 | XAU/USD | $12 | $100 per $1 | 0.08 lots |
| $2,000 | $20 | EUR/USD | 25 pips | $10 | 0.08 lots |
Notice what the formula does to a wide stop: it makes the position smaller, not the loss bigger. A trader who "cannot afford a wide stop" is really saying he wants a position larger than his account allows. The formula says no, politely, every time.
Where the stop has to sit
A stop is not a budget. It is the price at which the reason for the trade is proven wrong. Two tests, both must pass:
- Structural: beyond the level the trade depends on. Long from a demand zone → below the zone and below the liquidity just under it (the stops that get swept before the zone holds). Short from supply → above it. A stop inside the zone is a donation.
- Statistical: at least one ATR of the entry timeframe beyond that level. If the hourly ATR is 12 pips and your structural stop is 4 pips below the zone, noise will take it. Widen the stop and shrink the size.
The terminal's engine places stops this way — beyond the sweep and the zone, with an ATR buffer — and shows the reward-to-risk to each target from the entry edge. If the first target is less than 1.5× the risk, the trade is not worth the stop.
Exposure: the risk you did not know you took
Three longs in EUR/USD, GBP/USD and AUD/USD at 1% each are not three 1% risks. They are one 3% short-dollar risk, and a hawkish Federal Reserve headline closes all three at once. Rules that keep exposure honest:
- Count risk by currency, not by pair. Total open risk in any one currency ≤ 2% of the account.
- Total open risk ≤ 3%. Across everything, at any moment.
- Gold and the dollar are correlated (inversely, most of the time). A long gold and a short EUR/USD are partly opposite bets on the same thing.
- Halve size into scheduled events. Or stand aside. A red-folder release is a known moment of doubled volatility; sizing for the quiet hour and holding through it is how a 1% risk becomes 3%.
The daily limit and the drawdown maths
The losses that end accounts rarely come from one trade. They come from the fourth, fifth and sixth trades of a day that started badly. A daily loss limit — 2% to 3% of the account, after which the platform is closed until tomorrow — is the single rule with the best ratio of simplicity to lives saved. Set it in the platform where it can be enforced, not in a journal where it can be negotiated.
The reason is the recovery curve. A drawdown of 10% needs an 11% gain to recover; 25% needs 33%; 50% needs 100%. Small, capped losses keep you in the flat part of that curve where recovery is routine. Large ones put you where recovery requires exactly the behaviour — swinging for size — that caused the drawdown.
| Drawdown | Gain needed to recover |
|---|---|
| 5% | 5.3% |
| 10% | 11.1% |
| 25% | 33.3% |
| 50% | 100% |
Reward-to-risk and win rate, together
Neither number means anything alone. At 1:2 reward-to-risk you need a 34% win rate to break even before costs; at 1:1 you need 50%; at 1:3, 25%. A Smart Money setup — stop beyond the sweep, first target at the next pool, second at the opposing zone — typically offers 1:2 to the first target and 1:4 or more to the second. That is why the method tolerates a win rate near 40% and still compounds. Taking profit early "to be safe" destroys this: it turns a 1:3 plan into a 1:1 plan with a 40% win rate, which loses.
A pre-trade checklist
- Risk amount in money, from the account size, before looking at the chart.
- Stop at the structural level plus one ATR. Size from the formula.
- Reward to the first target ≥ 1.5× risk, or no trade.
- Open risk per currency ≤ 2%, total ≤ 3%, after this trade.
- No scheduled high-impact release inside the next hour for either currency.
- Daily loss so far below the limit.
Six lines. They take thirty seconds and they are the whole difference between a trading career and a trading story. The rest of this blog — structure, positioning, timing — is about finding good trades. This post is about being there to take them.
Everything on SMC Terminal is analysis and education, not a recommendation to buy or sell. Trading carries a substantial risk of loss. Manage your risk.