Liquidity Grab vs Breakout: How to Assess the Difference
Liquidity grab trading rests on one distinction: a move through a level that reverses was a grab of the stops behind it, and a move through a level that holds was a breakout. In the moment they look identical. This guide gives the five tells that separate them within a candle or two of the level, the context that makes one more likely than the other, and the way to trade each without guessing which it is.
Liquidity grab trading starts from a fact about where orders sit. Beyond every obvious level, the previous day's high, a double bottom, a round number, a trend line everyone has drawn, there is a cluster of stop orders: stops from traders positioned against the level and entry orders from traders waiting for the break. That cluster is liquidity, and large participants who need to fill size use it: price is pushed through the level, the stops execute into their orders, and price reverses. The same push through the same level is sometimes a genuine breakout that continues. For the first candle they are indistinguishable, and traders who guess are wrong about half the time. This guide gives the tells that separate them within a candle or two, the context that tips the odds beforehand, and a way to trade the level that does not require knowing in advance.
Why the two look the same at first
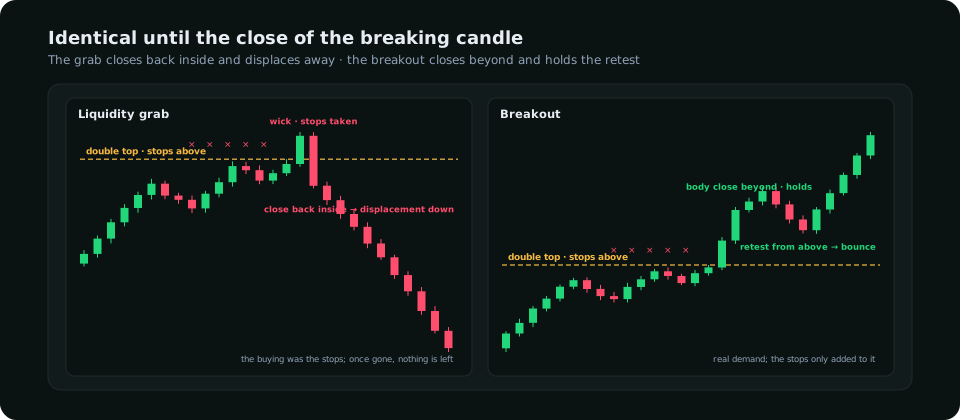
Both begin with price accelerating into the level, both trade through it, and both trigger the stops. The divergence is in what happens once the stops are gone. In a grab, the buying that pushed through was the stops themselves, and once they are consumed there is nothing left; price falls back through the level and the move away is fast because the trapped breakout traders are now stopped in turn. In a breakout, the push was real demand that the stops merely added to, and when the level is retested from the other side the demand is still there. The liquidity sweep guide covers how to find the levels where this plays out; this article is about reading the outcome.
Five tells, in the order they appear
| Tell | Grab | Breakout | When it is visible |
|---|---|---|---|
| 1 · Close of the breaking candle | Closes back on the original side; the break is a wick | Closes beyond the level with a body, ideally in the top third of its range | At the close of that candle |
| 2 · Displacement | The next candle is a wide body away from the level, back in the original direction | The next candle holds beyond the level or extends | One candle later |
| 3 · Retest | No retest; price does not return to the level from the far side | A pullback to the level from the far side is rejected | Two to six candles later |
| 4 · Time | Happens at a session open, a release, or a thin hour | Happens on sustained participation in an active session | At the moment of the break |
| 5 · Follow-through | Structure on the lower timeframe breaks in the original direction | Structure breaks in the breakout direction and holds | Within the next few candles |
The first tell does most of the work and is available soonest. A wick through a daily level on an hourly candle that closes back inside is, by a wide margin, more often a grab than a breakout; a body close beyond the level on the timeframe that drew it is more often a breakout. The timeframe matters: a daily level is broken by a daily close, and an hourly close beyond it is only the first piece of evidence. The support and resistance guide treats the same distinction from the level's side.
Context that tips the odds beforehand
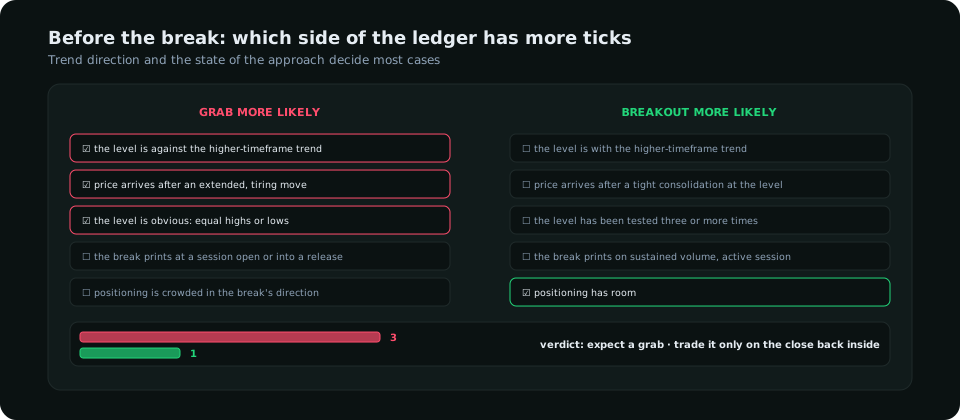
- Higher-timeframe trend. A break against the daily trend is usually a grab (it is the sweep that precedes the trend's next leg); a break with it is more often real. This is the single strongest prior.
- The approach. Price that arrives at the level after an extended, tiring move is arriving to take stops and reverse; price that arrives after a tight consolidation pressed against the level has built the energy to go through.
- How obvious the level is. Equal highs that every chart shows are a stop cluster first and a resistance level second; the more obvious, the more likely the grab.
- Number of tests. A level tested once is strong and more often grabbed; a level tested four times has had its orders consumed and more often breaks for real.
- Time of day. Session opens and the minutes around releases are when grabs are engineered; a break at 10:00 UTC on a quiet day is less often a grab and more often a drift that fails for lack of participation, which is a third outcome and a reason to wait for the retest.
- Positioning. A breakout in the direction speculators are already crowded (COT index above 85) has fewer new buyers behind it and more often fails; the COT read is the weekly input here.
Trading it without predicting it
The trader does not need to know in advance. Both outcomes offer a trade with a defined stop, and the first tell decides which one is on.
If the breaking candle closes back inside (the grab): enter in the original direction on that close or on the next candle's open, stop beyond the wick's extreme, first target the opposite side of the range or the nearest liquidity in the move's direction. The trapped breakout traders' stops are the fuel. This is the reclaim entry the order block guide describes, read from the level rather than the block.
If the breaking candle closes beyond (the breakout): do not chase the close. Wait for the retest of the level from the far side; enter on the rejection, stop beyond the level back on the original side (so that a grab that now reverses takes you out at a defined cost), first target the next structural level. The fair value gap left by the breakout candle is often the exact retest point.
What is not a trade: entering on the push through the level before it closes. That is the position both outcomes are designed to punish.
Frequently asked
What is a liquidity grab in trading?
A move through an obvious level that triggers the stop and entry orders clustered beyond it and then reverses, because the orders were the point. It is identified by the breaking candle closing back on the original side and the next candle displacing away.
How can you tell a liquidity grab from a real breakout?
By the close of the breaking candle first (back inside is a grab, beyond with a body is a breakout), then by displacement and the retest. Before the break, the higher-timeframe trend and the state of the approach set the odds.
Should I trade breakouts or fade them?
Neither by default. Trade the close: fade a wick that closes back inside, buy the retest of a body close that holds. Entering on the push itself is the position both outcomes are built to stop out.
Everything on SMC Terminal is analysis and education, not a recommendation to buy or sell. Figures in the example are illustrative. Trading carries a substantial risk of loss. Manage your risk.