AUD/USD at a Nine-Month Low Near 0.6816: Why the Aussie Keeps Falling With the RBA at an 18-Year High
The Australian dollar fell to 0.6816 against the US dollar on 12 November 2026, its weakest since early January, nine days after the Reserve Bank of Australia raised its cash rate to 4.85%, the highest since 2008. The pair has the higher policy rate on its side and is falling anyway, because the RBA's 6–3 vote and dropped guidance say its cycle is over while the Fed's December hike is fully priced and the dollar index sits at a 19-month high above 103. This AUD/USD forecast explains the divergence in rate expectations, the role of risk sentiment and the Hormuz headlines, the levels from 0.6850 to 0.6750, and what has to change for the Aussie to turn.
Written on 14 November 2026, with levels as of the 13 November close.
This AUD/USD forecast starts with a contradiction. The Reserve Bank of Australia raised its cash rate to 4.85% on 3 November 2026, its fifth increase of the year and the highest level since late 2008. The Federal Reserve's target range is 3.75–4.00%. The Australian dollar therefore carries the higher policy rate by 85 to 110 basis points, and it is falling: 0.6974 within an hour of the RBA's decision, under 0.6850 by 11 November, and 0.6816 in Sydney trading on the evening of 12 November, the weakest since early January and a nine-month low. The RBA's own trade-weighted index hit 63.6, also a nine-month low. The resolution of the contradiction is that currencies price the change in a rate gap, not its level, and the change is running one way. The RBA's vote was 6–3 with three members preferring to hold, its statement dropped September's line about raising rates further if needed, and Westpac and most of the street now treat 4.85% as the peak with a pause to be assessed on 8 December. The Fed, a day later in the calendar, is fully priced for a hike on 9 December with a half-point under discussion, and the dollar index is above 103 for the first time since April 2025. Add a week of risk aversion driven by Nvidia and fading hopes for US–Iran diplomacy, and the Aussie has three forces against it and one in its favour. This guide sets out each of them, the levels from 0.6850 down to 0.6750, and what would have to change for the pair to turn. The October CPI guide covered the run-up to the RBA decision; this is what happened after it.
Level against direction
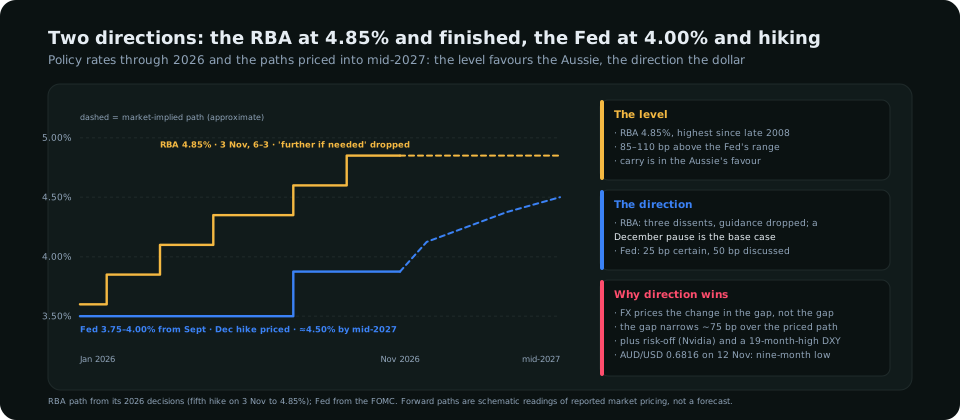
| RBA | Fed | Effect on AUD/USD | |
|---|---|---|---|
| Policy rate | 4.85% | 3.75–4.00% | Favours the Aussie: positive carry of 85–110 bp |
| Last move | +25 bp on 3 Nov, 6–3 vote | Hold on 28 Oct, 10–2 with two for a hike | Favours the dollar: the dissents point in opposite directions |
| Guidance | "Further if needed" dropped; minority sees downside risks and no wage pick-up | No pre-commitment, but officials discussing 50 bp | Favours the dollar |
| Next meeting | 8 Dec: pause expected; peak of the cycle | 9 Dec: 25 bp fully priced | Favours the dollar: the gap narrows by at least 25 bp in a week |
| Market path to mid-2027 | Roughly flat; some pricing of a little more, forecasters see cuts in late 2027 | Toward 4.50% | Favours the dollar: the gap closes by about 75 bp |
The interest-rates guide explains the mechanism: a pair moves when expected rates move, and a central bank that has just finished is competing with one that has just started. The Aussie had its rally when the RBA was hiking and the Fed was on hold, and the AUD/USD break above 0.7000 in October was the top of that period; the 24 October structure guide marked the break and the record speculative short against it. The short was right.
The other two forces
- The dollar's own trend. The dollar index closed 13 November near 103.4, its highest since April 2025, after three straight weekly gains built on hot inflation, strong payrolls and a December hike moving from likely to certain. The dollar index guide covers the basket; the Aussie is not in it, but it trades as a high-beta version of whatever the basket is doing.
- Risk. The Australian dollar is the currency the market sells when it wants less risk, and the second week of November gave it reasons: Nvidia's CEO departure and a 13% intraday fall on 12 November, a sixth weekly loss for bitcoin, and fading hopes that the Vance–Rezaei channel would end the Iran war quickly. Capital Brief's description of the 0.6816 low, "risk sentiment soured and traders priced in further Fed hikes", is the whole story in one line. The stock market guide covers the equity side.
The one force in the Aussie's favour, carry, is real and it is why the pair has fallen gradually rather than collapsed. A trader short AUD/USD pays the rate difference every night. That cost is small against a 2% move in a week, but it means the short is a trade that needs the trend to continue, not a position to hold through a range.
The chart
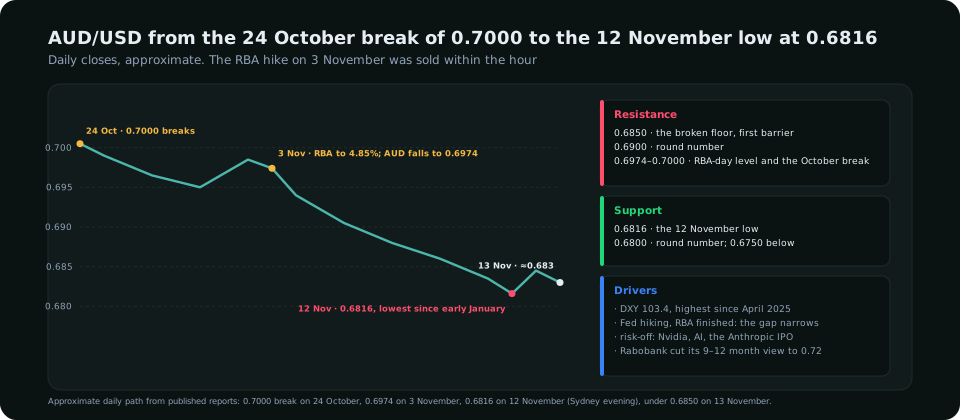
| Level | What it is | Read |
|---|---|---|
| 0.7000 | The October break; round number | The level a genuine reversal would have to reclaim; not in play this month |
| 0.6974 | Where the pair fell to within the hour of the RBA hike | The RBA-day pivot; a close above it says the hike was sold too hard |
| 0.6900 | Round number | First real resistance; sellers from the post-RBA slide sit here |
| 0.6850 | Broken on 11 November | The nearest barrier; the pair spent 13 November just under it |
| 0.6816 | 12 November low; lowest since early January | The reference low; a sweep and reclaim is the first long setup |
| 0.6800 | Round number | Where the obvious stops are |
| 0.6750 | Next support below | The target if 0.6800 gives way with acceptance |
The structure is a sequence of lower highs and lower lows since the 0.7000 break, which is a trend by any definition; the break of structure guide covers how to read the swings, and the change-of-character guide the close above a prior lower high (0.6900 is the one that counts) that would be the first warning the trend had ended. The 14-day RSI on the daily chart is in the low 30s: weak, not yet an extreme, the same reading the RSI guide describes as "the trend being a trend".
Three scenarios into the December meetings
| Scenario | Conditions | AUD/USD | Rough odds |
|---|---|---|---|
| Trend continues | Hot October PCE, Fed 25 bp with a hawkish path on 9 Dec, RBA pauses on 8 Dec, risk stays soft | 0.6800 breaks; 0.6750 before year-end | ≈ 45% |
| Range | Data mixed; both central banks deliver what is priced | 0.6800–0.6900 into the new year; the carry makes the short expensive to hold | ≈ 35% |
| Relief rally | Soft US data, a dovish Fed path, an equity rebound after Nvidia's earnings, or a real Iran ceasefire that lifts risk | Back through 0.6900 toward 0.6974; 0.7000 needs the RBA to sound unfinished | ≈ 20% |
Rabobank cut its nine- and twelve-month forecast to 0.72 from 0.73 this week while keeping it above the current price, which is the consensus shape: lower near term while the Fed hikes, higher later when the gap stops narrowing. The trade is in the timing of "later", and nothing on the December calendar supplies it.
How to trade it
- With the trend: sell the retest of 0.6850–0.6900. A failure under the broken floor is the setup; stop above 0.6910, first target 0.6816, second 0.6750. The carry cost argues for taking profit at the levels rather than trailing indefinitely.
- Against it: only at 0.6800 with a reason. A sweep of the round number that closes back above 0.6816 on the same day, ideally after a risk event has passed (Nvidia on 17 November is the obvious one), is the long setup. Stop under the sweep, target 0.6900.
- Size for an event week. The pair has moved 150 pips in nine sessions and two central-bank decisions arrive a day apart in December; the risk management rules set the size from the stop, not from conviction.
What to read in the terminal
The Positioning module shows the CFTC's large speculators in the Australian dollar, who were record short into the October break and have been paid; the question the next report (due 16 November after the holiday delay) answers is whether that short is being covered at the lows, which would be the first positioning reason to expect a bounce. The Valuation and Yields read scores AUD/USD against the two-year rate gap and shows the pair trading below where the level of the gap would put it and in line with where the direction of the gap is taking it, which is this guide's argument as a number. Both reads sit in Symbol Analysis for the pair, part of every plan on the pricing page; a free account opens the public shell.
Frequently asked
Why is AUD/USD falling when the RBA just raised rates?
Because currencies price the direction of rate expectations, not the level. The RBA's 3 November hike to 4.85% came with a 6–3 vote and dropped guidance, so markets treat it as the last of the cycle, while the Fed's December hike is fully priced and a half-point is under discussion. The gap in the Aussie's favour is expected to narrow, the dollar index is at a 19-month high, and risk sentiment has soured.
What is the AUD/USD nine-month low?
0.6816, reached in Sydney trading on the evening of 12 November 2026, the weakest since early January. The RBA's trade-weighted index hit 63.6, also a nine-month low, the same day.
What are the key AUD/USD levels now?
Resistance at 0.6850, 0.6900 and 0.6974–0.7000; support at 0.6816, 0.6800 and 0.6750. A daily close above 0.6900 would be the first change of character in the downtrend from the October break.
What is the AUD/USD forecast for the rest of 2026?
Lower or sideways into the December central-bank meetings, with 0.6750 the downside target if 0.6800 breaks and 0.6900 capping rallies, unless US data soften or risk appetite recovers. Bank forecasts such as Rabobank's 0.72 in nine to twelve months describe a recovery once the Fed stops narrowing the rate gap, which is a 2027 story.
Everything on SMC Terminal is analysis and education, not a recommendation to buy or sell. Levels are from published market reports through 13 November 2026 and change continuously. Trading carries a substantial risk of loss. Manage your risk.