October CPI Ran Hot at 0.4%: Why a Third Straight 0.3% Core Print Has the Market Debating a Half-Point December Hike
US consumer prices rose 0.4% in October 2026 against a 0.3% forecast, and core CPI rose 0.3% for the third month running against 0.2% expected. Shelter was more than thirty percent of the increase, food rose 0.5% and gasoline 1.0% after seasonal adjustment; no twelve-month rate was published because of last year's shutdown gap. Within hours the market had a quarter-point hike at the 8–9 December FOMC meeting fully priced and Fed officials were discussing a half point. This guide breaks the report down, explains why the decimal mattered so much, and sets out what it means for the dollar, yields, gold and the trades into December.
Written on 14 November 2026, four days after the release, with market pricing as of the 13 November close.
The October CPI report, published by the Bureau of Labor Statistics on 10 November 2026, was hot in the way that matters: not by a lot, but in the component that decides policy. Headline US inflation rose 0.4% on the month against a 0.3% forecast. Core CPI, which strips out food and energy, rose 0.3% against 0.2% expected, and it was the third consecutive month at that pace. Shelter accounted for more than thirty percent of the monthly increase, food rose 0.5%, and gasoline rose 1.0% after seasonal adjustment even though pump prices fell slightly in raw terms. For the second month the BLS published no twelve-month rate for the all-items index, because the government shutdown of autumn 2025 left a hole in the October 2025 data that no comparison can span. Markets did not need the annual number. Within hours the probability of a quarter-point increase at the 8–9 December FOMC meeting, tracked by the CME FedWatch tool, had moved from the low-80s to effectively fully priced, and by the end of the week Fed officials were debating in public whether the increase should be half a point. This guide breaks the report down, explains why one decimal carried so much weight, and sets out what it means for the dollar, Treasury yields, gold and the positions worth holding into December. The December odds guide tracks the repricing from the Fed's October hold; this is the release that finished it.
The report, line by line
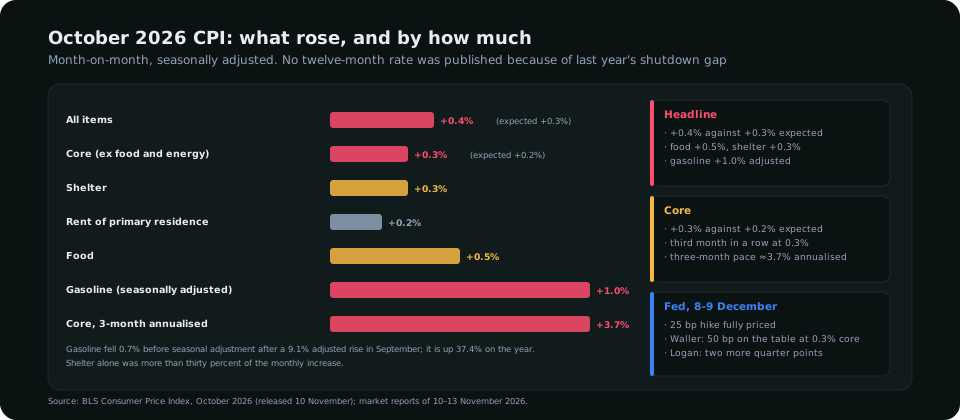
| Component | October (m/m) | Expected | Read |
|---|---|---|---|
| All items | +0.4% | +0.3% | Food and shelter did the work; energy helped less than the raw pump price suggested |
| Core (ex food and energy) | +0.3% | +0.2% | Third straight 0.3%; roughly 3.7% annualised over three months |
| Shelter | +0.3% | — | More than thirty percent of the headline increase; rent of primary residence a cooler +0.2% |
| Food | +0.5% | — | The largest monthly food rise of the autumn |
| Gasoline | +1.0% (seasonally adjusted); −0.7% unadjusted | — | After +9.1% adjusted in September; +37.4% over twelve months on the energy shock |
| Twelve-month rate | Not published | — | October 2025 data were never collected during the shutdown |
Two things in the table explain the market's reaction better than the headline. The first is the gasoline line: pump prices fell in October, yet the seasonally adjusted index rose, because October is normally a month of falling prices and this year's decline was smaller than the seasonal pattern expects. That means the headline figure was not flattered by energy; it was held down by it less than usual. The second is the core run rate. One month at 0.3% is noise. Three in a row is a trend of about 3.7% a year, nearly twice the Fed's target, and it arrived two weeks after the Fed had described inflation as "elevated" and growth as "strong". The statement guide explains why that combination was already pointing to December.
Why the decimal mattered
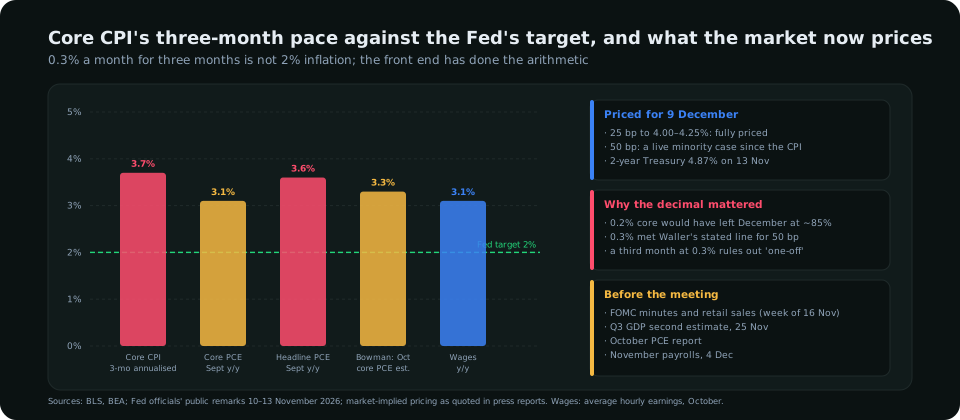
- Governor Waller had drawn the line in advance. He had said publicly that a core reading of about 0.3% or higher for October would justify considering a half-point increase in December. The print landed exactly there. A 0.2% would have left the quarter-point as the only question; 0.3% opened the second one.
- Dallas Fed President Logan went further. She said she sees the need for two additional quarter-point increases, which is a statement about 2027 as much as December.
- Vice Chair Bowman put a number on the next PCE. She expects October core PCE, the Fed's preferred gauge and due before the meeting, to have reached about 3.3% from 3.1% in September. A central bank that expects its own measure to rise is not pausing.
- The 2-year did the arithmetic. The 2-year Treasury yield rose to 4.87% by 13 November, back above where it had stood before the October meeting, and the 10-year to 5.15%. The yields guide explains why the long end matters as much as the front for the dollar and gold.
The point for traders is that the quarter-point hike is no longer a trade. It is in every price. What is left is the size of the move, the path the December projections draw for 2027, and the data between now and 9 December that can change either.
What the report means for each market
| Market | Reaction and read |
|---|---|
| US dollar | The dollar index rose to about 103.4 by 13 November, its highest since April 2025 and a third straight weekly gain. Hot inflation with a Fed prepared to act is the strongest configuration the dollar has; the dollar index guide covers why the euro's 57.6% weight makes EUR/USD's nineteen-month low the same story |
| Treasury yields | Higher across the curve: 2-year 4.87%, 10-year 5.15%, 30-year 5.48%. The 10-year added about thirty basis points in the week |
| Gold | Fell to a one-year low of $3,852 on 12 November as real yields rose and the dollar firmed; the gold liquidity guide reads the move from the chart |
| Silver | Back under $50 and down more than 5% on the week; the silver forecast covers the levels |
| Equities | Mixed: a higher discount rate hurts long-duration technology stocks most, and the Nasdaq fell on the week while energy led; the stock market guide covers the week's rotation |
| Yen and Aussie | USD/JPY near 160 and AUD/USD at a nine-month low: the two pairs most sensitive to a widening US rate advantage; see the AUD/USD guide |
What is missing from the report
Three caveats keep the reading honest. The absence of a twelve-month rate means headlines quoting "inflation at X%" are either using the three-month pace or an unofficial reconstruction; the Fed will look at PCE, which does have an annual figure, 3.6% headline and 3.1% core for September. Shelter, the biggest driver, is a lagging component that reflects leases signed months ago; rent of primary residence at 0.2% hints that the pipeline is cooler than the index. And gasoline's seasonal quirk flattered neither side: raw prices fell, which households felt, while the adjusted index rose, which the Fed sees. None of these caveats changes December. All of them matter for whether December is the last move.
How to trade the run-in to 9 December
- Trade the path, not the hike. The quarter point is priced. The dollar's reaction on decision day will come from the Summary of Economic Projections and the statement's language about further increases. Position for the 2027 median, not the December number.
- The next inflation number is PCE, not CPI. The October PCE report is the last inflation reading before the meeting. Bowman has told you what the Fed expects (about 3.3% core); a print above it is the hawkish surprise, a print at 3.1% the dovish one.
- Watch the 2-year through 4.90%. A close above it says the market is moving from 25 toward 50; a fall back under 4.75% says the half-point case is fading. Dollar pairs follow the 2-year more faithfully than any headline.
- Size for the first candle. CPI days have produced forty-pip first candles in EUR/USD all autumn and the December decision will produce more; the economic calendar guide covers being positioned before rather than during a release, and the risk management rules the size.
What to read in the terminal
The Macro Economics module shows the US inflation inputs, CPI, core CPI, PCE and the three-month run rates, against the Fed's target and the market-implied policy path on one screen, with the red-events panel counting down to the October PCE report, the 4 December payrolls and the 9 December decision. The inflation regime feeds every dollar pair's verdict in Symbol Analysis, so a hot CPI shows up as a stronger dollar bias without the trader parsing the BLS tables. The module is part of every plan on the pricing page; a free account opens the public shell.
Frequently asked
What was the October 2026 CPI inflation rate?
Consumer prices rose 0.4% in October on a seasonally adjusted basis, above the 0.3% forecast, and core CPI rose 0.3% against 0.2% expected. The BLS did not publish a twelve-month rate because October 2025 data were never collected during last year's government shutdown; core prices have risen at about a 3.7% annualised pace over the last three months.
Why did the CPI report raise December rate hike odds?
Because core inflation printed 0.3% for a third straight month, the level Governor Waller had publicly named as the threshold for considering a half-point increase, and because it followed strong GDP and payrolls data. Markets moved to price a quarter-point hike at the 8–9 December FOMC meeting as a near certainty and began pricing some chance of a half point.
What drove the October increase?
Shelter rose 0.3% and was more than thirty percent of the monthly rise, food rose 0.5%, and gasoline rose 1.0% after seasonal adjustment (it fell 0.7% unadjusted). Gasoline is up 37.4% over twelve months on the energy shock.
What does hot CPI mean for the dollar and gold?
A stronger dollar and weaker gold. The dollar index rose to about 103.4, its highest since April 2025, Treasury yields rose across the curve, and gold fell to a one-year low near $3,852 on 12 November as real yields climbed.
Everything on SMC Terminal is analysis and education, not a recommendation to buy or sell. Figures are from the BLS release of 10 November 2026 and published market reports through 13 November; market pricing changes continuously. Trading carries a substantial risk of loss. Manage your risk.