The Fed Held, the Bond Market Split: What a 5% Ten-Year Yield Means for the Dollar, Gold and USD/JPY
The Federal Reserve left rates at 3.75–4.00% on 28 October 2026 and the Treasury market gave two answers at once: the 2-year yield fell toward 4.70% because Chair Warsh would not pre-commit to a December hike, while the 10-year rose to 5.04% and the 30-year to 5.36%. The dollar slipped, gold settled lower and USD/JPY ended near 158, where it started. Two weeks of data settled the argument. This guide explains why the curve split, what has happened since, and what 10-year yields above 5% mean for the dollar index, gold and the yen.
Written on 14 November 2026, with market levels as of the 13 November close. The events described run from the FOMC decision of 28 October to the inflation reports of 10–13 November.
On 28 October 2026 the Federal Reserve held interest rates at 3.75–4.00%, and the bond market answered with two different verdicts in the same hour. The 2-year Treasury yield fell three to four basis points, to about 4.70%, because Chair Kevin Warsh refused to pre-commit to a December increase. The 10-year Treasury yield rose almost five basis points to 5.04% and the 30-year to 5.36%, because nothing he said made inflation look closer to 2%. The dollar index slipped a fraction during the press conference, gold futures settled lower, and USD/JPY ended the day near 158, exactly where it had started. A market that cannot agree with itself is usually waiting for the next number, and this one had two within forty-eight hours: the September PCE report and the Bank of Japan's decision. This guide explains why the curve split, which verdict survived, and what a 5% ten-year yield means for the dollar, gold and the yen now that it is back. The decision-day guide covered the statement itself; this piece is about the bond market's reading of it and the two weeks that followed.
Two verdicts in one curve
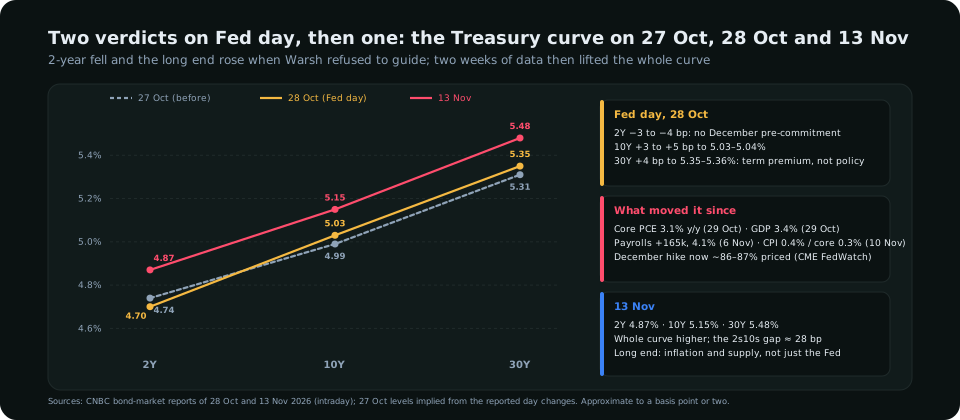
| Maturity | Fed day move | What it prices | Why it moved that way |
|---|---|---|---|
| 2-year | −3 to −4 bp, to ≈4.70% | The policy path over the next eight meetings | No forward guidance, "more information" first, fewer meetings from 2027: a slower cadence than the market had assumed |
| 10-year | +3 to +5 bp, to 5.03–5.04% | Policy path plus the inflation and term premium | Inflation "remains elevated" with no plan to hurry; a central bank that waits lets the long end carry the risk |
| 30-year | +4 bp, to 5.35–5.36% | Mostly term premium and supply | Two dissents for a hike, a chair who declines to guide, and deficit financing that does not shrink |
The short end read the press conference as dovish because the chair would not promise December. The long end read the same press conference as a central bank prepared to tolerate inflation above target for longer, and charged for it. Both were correct about what they heard. The question was which reading the data would support, and the yields guide explains why that distinction matters so much for currencies: the dollar follows the 2-year, gold fights the 10-year real yield, and the yen answers to the gap between US and Japanese long rates.
How the other markets voted on the day
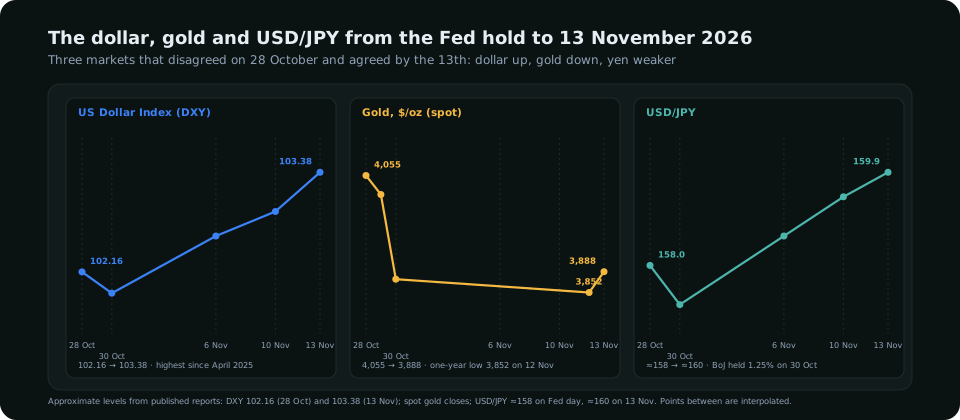
- Dollar index: down. DXY slipped about 0.16% to 102.16, following the 2-year. A hawkish hold that lowers the front end is a dollar-negative on the day, whatever the long end does, and the dollar-after-the-Fed guide written on 29 October set out why.
- Gold: lower, but barely. Spot held near $4,055, down about 0.15%, and futures settled lower. Gold took the long end's side: a higher 10-year with the policy rate unchanged is a higher real yield, and a higher real yield is gold's heaviest weight. The real-yields guide covers the mechanism.
- USD/JPY: unchanged near 158. The pair had two forces cancelling: a softer US front end against a wider US–Japan long-end gap. It waited for the Bank of Japan, as the intervention-watch guide said it would.
What decided it: five releases in sixteen days
| Date | Release | Result | Which verdict it supported |
|---|---|---|---|
| 29 Oct | September PCE | Core +0.3% m/m, 3.1% y/y (from 3.0%); headline +0.5%, 3.6% y/y | Long end: inflation re-accelerating, not fading |
| 29 Oct | Q3 GDP, advance | +3.4% annualised (Q2: 2.2%); final private sales +4.9% | Both: growth strong enough to hike into |
| 30 Oct | Bank of Japan | Held 1.25%, 8–1 with Takata voting for 1.50%; 2027 price outlook raised to 2.6% | Yen firmed to 157.15, then gave most of it back |
| 6 Nov | October payrolls | +165,000 against ≈60,000 expected; unemployment 4.1%; wages +3.1% y/y | Short end: a December hike back toward 80% |
| 10 Nov | October CPI | +0.4% m/m; core +0.3% for a third month (no annual rate published, owing to last year's shutdown gap) | Both: December fully priced, 50 bp discussed |
By 13 November the 2-year was 4.87%, the 10-year 5.15% and the 30-year 5.48%, the ten-year having added about thirty basis points in a single week. The short end's dovish reading lasted two days; the long end's hawkish one lasted and then spread to the front. The December meeting on 9 December is now priced as a certainty for a quarter-point increase, with Governor Waller saying a half-point is possible if core CPI holds at 0.3% and Dallas Fed President Logan calling for two more increases. The December odds guide follows that repricing day by day.
What a 5% ten-year means for each market
The dollar
The dollar index closed 13 November near 103.4, its highest since April 2025 and its third weekly gain in a row. The connection is not the 10-year directly but the combination: a 2-year that has risen back to 4.87% because December is certain, and a 10-year above 5% that says the market does not expect the Fed to reverse soon. Against the euro, whose central bank sits at 2.50% and is losing its president in February, and the yen, whose central bank is at 1.25%, that is a rate advantage of 150 to 275 basis points at the front and more at the back. The dollar index guide covers what the basket weights do with that advantage; the short version is that 57.6% of it is the euro, and EUR/USD is at a nineteen-month low.
Gold
Gold fell from $4,055 on Fed day to a one-year low of $3,852 on 12 November and closed the week near $3,888. A 10-year yield of 5.15% with inflation expectations that have not risen as far means a real yield near its highest of the cycle, and gold pays nothing. The move was made worse by what it did to positioning: the drop on 12 November ran through stop-losses under bullish positions built over the previous fortnight. The gold liquidity-sweep guide reads the same move from the chart's side, and the why-gold-is-falling guide from October set out the macro case that has since played out. For gold to turn, one of three things has to happen: the 10-year back under 5%, the dollar index back under 102, or a Fed that signals December is the last move. None of them is on the calendar before 9 December.
USD/JPY
USD/JPY has risen from 158 to near 160, the level the Ministry of Finance defended in the past and the one every desk is watching again. The 10-year matters here more than anywhere: the US–Japan long-end spread is the carry that funds the position, and a US 10-year at 5.15% against a Japanese 10-year under 2% is as wide as it has been this cycle. The Bank of Japan's hold on 30 October, with one dissent for a hike and a higher inflation forecast, opened the door to December without walking through it, and the market has treated that as permission to sell yen until Tokyo says otherwise. Above 160 the risk is not economic; it is a phone call. Size accordingly.
What a 5% ten-year does not mean
- It is not a recession signal. The curve is not inverted; the 2s10s gap is about 28 basis points and positive. A long end that rises with growth at 3.4% is a repricing of inflation and term premium, not a forecast of a downturn.
- It is not only the Fed. The 30-year at 5.48% is a statement about supply and about how much compensation investors want for holding duration through a war-driven energy shock. A Fed hike in December does not necessarily push it higher; a credible path to 2% might even pull it lower.
- It is not a dollar guarantee. The dollar fell on 28 and 30 October with the 10-year above 5% both days, because the 2-year was falling. The front end drives the currency day to day; the long end sets the ceiling on how far the other side can push back.
What to read in the terminal
The Valuation and Yields module tracks the 2-year and 10-year against each dollar pair and against gold, and scores whether the currency is cheap or rich for the yield gap it carries; on 13 November it had the dollar fairly priced for the spread and gold over-sold for the real yield, which is a "no edge, wait" reading rather than a trade. The intermarket read in Symbol Analysis shows the correlation of each pair with the 10-year over the last sixty sessions, and USD/JPY's has been the tightest in the book. Those reads are part of every Pro plan on the pricing page, and the public shell of the dashboard can be opened before subscribing.
Frequently asked
Why did the 2-year yield fall when the Fed sounded hawkish?
Because the 2-year prices the path of the policy rate over the next two years, and Chair Warsh declined to commit to a December hike, said the Committee wanted more information first, and announced fewer meetings from 2027. Each of those lowered the expected pace of tightening even though the direction was unchanged. Two weeks of strong data then reversed it: the 2-year was 4.87% on 13 November.
Why did the 10-year rise on the same day?
The 10-year carries inflation and term premium on top of the policy path. A central bank that holds while inflation "remains elevated" and declines to hurry is asking the long end to bear more inflation risk, and the long end charged for it. The 10-year rose to 5.04% on 28 October and 5.15% by 13 November.
What does a 5% ten-year Treasury yield mean for gold?
With inflation expectations rising less than yields, it means a real yield near the highest of the cycle, which raises the cost of holding an asset that pays nothing. Gold fell from about $4,055 on Fed day to a one-year low of $3,852 on 12 November. A turn needs the 10-year back under 5%, the dollar index back under 102, or a Fed signal that December is the last hike.
What does it mean for USD/JPY?
A wider US–Japan long-end spread funds the carry trade that keeps USD/JPY bid; the pair rose from 158 on Fed day to near 160 by 13 November after the Bank of Japan held at 1.25%. Above 160 the main risk is intervention by Japan's Ministry of Finance, not the data.
Everything on SMC Terminal is analysis and education, not a recommendation to buy or sell. Yields and prices are from published market reports through 13 November 2026 and change continuously. Trading carries a substantial risk of loss. Manage your risk.