Silver Price Forecast: Why XAG/USD Fell Under $50, and What Has to Change Before It Rebounds
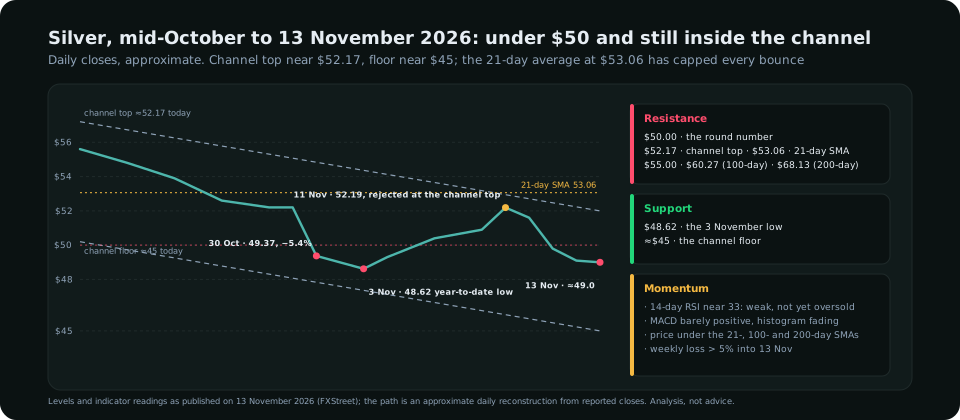
Silver closed below $50 an ounce on 30 October 2026 for the first time since November 2025, falling 5.4% in a day to $49.37, and set a year-to-date low of $48.62 on 3 November. A bounce to $52.19 on 11 November was sold at the top of a descending channel, and the metal ended the week of 13 November near $49, down more than 5%. This silver price forecast sets out the drivers (a December Fed hike fully priced, the dollar index at 103.4, the 10-year yield above 5%, gold at a one-year low), the levels that define the channel, the gold/silver ratio near 79, and the three scenarios for XAG/USD into the December FOMC meeting.
Written on 14 November 2026, with prices and indicator readings as of the 13 November close.
This silver price forecast starts with a number that would have seemed impossible in the summer: XAG/USD is trading near $49 an ounce. Silver closed below $50 on 30 October 2026 for the first time since November 2025, falling 5.4% in a single session to $49.37 as a December Fed hike firmed and gold dropped 3% to a four-month low on the same day. It set a year-to-date low of $48.62 on 3 November, bounced to $52.19 on 11 November, and was sold straight back down from the upper boundary of a descending channel to end the week near $49, a loss of more than 5% in five days. The question in the headlines is whether silver extends the decline or stages a surprise rebound. The honest answer is that the decline is the trend, a rebound is possible at any time because the metal is oversold on several measures, and the difference between a rebound that lasts a day and one that lasts a quarter is almost entirely in the hands of the Federal Reserve. This guide sets out the drivers, the levels, the gold/silver ratio and three scenarios into the 9 December FOMC meeting. The why-gold-is-falling guide covers the macro case for the senior metal; silver's is the same case with higher beta.
What happened, in order
| Date | XAG/USD | What happened |
|---|---|---|
| 28 Oct | Low 50s | Fed holds at 3.75–4.00% with two dissents for a hike; the 10-year rises above 5% |
| 29 Oct | Lower | September core PCE 3.1% y/y, headline 3.6%; GDP 3.4%; the dollar firms |
| 30 Oct | 49.37, −5.4% | First close under $50 since November 2025; gold −3% to a four-month low; December hike bets firm after the hot inflation data |
| 3 Nov | 48.62 low | The year-to-date low; the dollar index pushes toward its highest since early 2025 |
| 11 Nov | 52.19 high | A 2.4% bounce from a 49.14 open; rejected at the channel's upper boundary and under the 21-day average |
| 13 Nov | ≈49.0 | October CPI 0.4% and hawkish Fed remarks; a December hike fully priced; weekly loss above 5% |
Why Fed policy limits the recovery
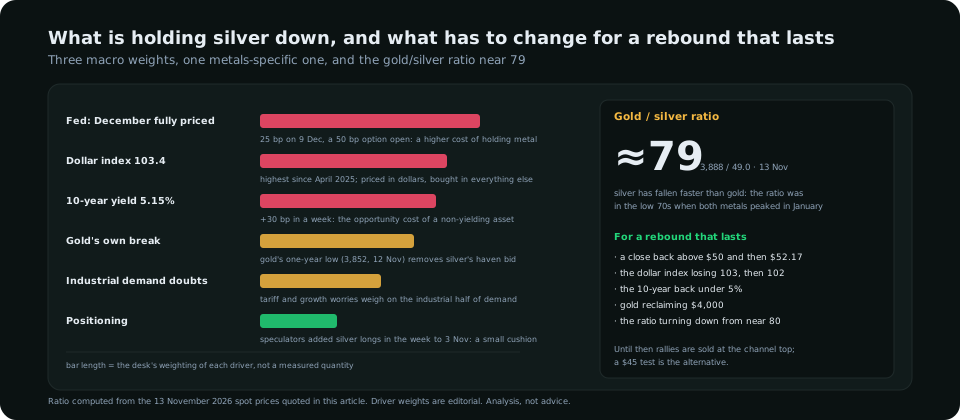
Silver pays no yield, so its price is a running comparison with what cash and bonds pay, and three things have moved against it at once:
- The policy rate is going up. A quarter-point increase on 9 December is fully priced, and Fed officials have spent the week discussing whether it should be a half. Every increase in the expected path raises the cost of holding metal instead of a Treasury bill.
- The long end is above 5%. The 10-year Treasury yield rose about thirty basis points in the week to 13 November, to 5.15%. With inflation expectations rising less, the real yield is near its highest of the cycle. The real-yields guide explains why that is the single most reliable headwind for precious metals, and it applies to silver with more force than to gold because silver's holders are more leveraged.
- The dollar is at a nineteen-month high. The dollar index near 103.4 makes silver more expensive for buyers in every other currency, and the dollar correlation guide covers why the relationship holds most of the time and what it looks like when it does not.
There is a fourth weight that is silver's alone. Roughly half of demand is industrial, and the tariff and growth worries that have accompanied the energy shock weigh on that half in a way they do not weigh on gold. When gold falls on real yields, silver falls on real yields and on the cycle, which is why it has fallen faster. The gold/silver ratio, which was in the low 70s when both metals peaked in January, is near 79 at $3,888 against $49.
The levels
| Level | What it is | Read |
|---|---|---|
| $68.13 | 200-day SMA | The long-term trend marker, far above price; irrelevant until the channel breaks |
| $62.50 · $60.27 | Horizontal barrier; 100-day SMA | The upper targets of a genuine reversal, not of a bounce |
| $55.00 | Round number | The first level a rebound would have to convert into support |
| $53.06 | 21-day SMA | Has capped every rally since the break; a daily close above it is the first sign the decline is pausing |
| $52.17 | Upper boundary of the descending channel | Where the 11 November bounce was sold |
| $50.00 | Round number | Resistance now; the line between "bounce" and "recovery" |
| ≈$49.0 | Price, 13 Nov | Under all three averages; RSI near 33, MACD barely positive with fading histogram |
| $48.62 | 3 November low | The only support between price and the channel floor |
| ≈$45 | Channel floor | The next notable support if $48.62 breaks |
The RSI guide covers why 33 is weak rather than oversold: in a downtrend the oscillator spends most of its time between 30 and 50, and a reading in the low 30s is the trend being a trend, not a buy signal. A bullish divergence at a retest of $48.62, with price lower and RSI higher than on 3 November, would be a different matter.
Three scenarios into December
| Scenario | Conditions | Path | Rough odds |
|---|---|---|---|
| Decline extends | October PCE hot, December hike confirmed with a hawkish path, dollar index holds above 103 | $48.62 breaks; the channel floor near $45 is tested before the FOMC | ≈ 40% |
| Range inside the channel | Data mixed, 25 bp delivered as priced, dollar stalls | $48.62–$53 for the rest of the month; rallies sold at the channel top, dips bought at the low | ≈ 40% |
| Rebound that lasts | A soft payrolls or PCE print, the 10-year back under 5%, gold reclaiming $4,000 | A close above $50, then $52.17 and $53.06; $55 becomes the target and the channel is broken | ≈ 20% |
The conditions in the third row are the answer to the question in the title. Silver does not need the Fed to cut; it needs the Fed to stop adding to the path, the dollar to lose 103, and gold to stop falling. None of those is scheduled before the December meeting, which is why the rebound case is the smallest. A "surprise rebound" without them is a short-covering rally of the 11 November kind: real, tradeable, and over at the channel top.
How to trade it
- With the trend: sell rallies into $52–53. A failure under the 21-day average with the channel top overhead is the setup that has paid three times. Stop above $53.50, target the prior low and then the channel floor.
- Against the trend: only at $48.62 with a reason. A sweep of the 3 November low that reclaims it on the same day, ideally with RSI divergence, is the one long setup the chart offers. Stop under the sweep, target $50 and then $52.
- Size for silver's range, not gold's. Silver's average true range in dollars is small, but in percentage terms it has been running at two to three times gold's; a stop that is 1% of price in gold needs to be 2–3% in silver to survive the same noise. The ATR guide covers the conversion and the risk management rules the lot size that follows.
- Watch the ratio. A gold/silver ratio turning down from near 80 while both metals fall means silver has stopped underperforming, which historically precedes silver's own turn. A ratio still rising means the industrial half of the story is getting worse.
What to read in the terminal
The desk publishes its metals charts, with the channel, the invalidation and the targets, on the Technical Analysis page when the structure changes. Inside the terminal, the COT positioning read for silver showed large speculators adding to longs in the week to 3 November even as the price fell, a small cushion rather than a signal, and the Valuation and Yields read scores both metals against the real yield they are fighting; the feature tour shows how those reads combine into one verdict, and every one of them is part of the plans on the pricing page. The metals indicators guide covers the chart tools that transfer directly from gold to silver.
Frequently asked
Why did silver fall below $50?
Expectations of a December Fed rate hike firmed after hot September inflation data and a strong third-quarter GDP report, the 10-year Treasury yield rose above 5%, the dollar strengthened, and gold fell 3% on the same day. Silver, which pays no yield and has a large industrial component, fell 5.4% to $49.37 on 30 October 2026, its first close under $50 since November 2025.
What is the silver price forecast for the rest of November 2026?
The trend is down inside a descending channel with a top near $52.17 and a floor near $45. The base case is a continued decline toward $48.62 and then the channel floor, or a range between $48.62 and $53, into the 9 December FOMC meeting. A rebound that lasts needs a close above $50 and then $52.17 and $53.06, which in turn needs softer US data, a lower dollar and a gold price back above $4,000.
What is the gold/silver ratio telling us?
At about 79 (gold $3,888 against silver $49) it is well above the low 70s seen when both metals peaked in January, which means silver has fallen faster than gold. A ratio that stops rising is usually the first sign that silver's underperformance is ending; one that keeps rising says the industrial-demand half of the story is worsening.
Is silver oversold?
Not by the usual definition. The 14-day RSI is near 33, above the 30 line, and in a downtrend readings in the low 30s are normal rather than extreme. A bullish divergence at a retest of $48.62 would be the first technical sign of exhaustion.
Everything on SMC Terminal is analysis and education, not a recommendation to buy or sell. Prices, levels and indicator readings are from published reports through 13 November 2026 and change continuously. Trading carries a substantial risk of loss. Manage your risk.