Nvidia Lost Its CEO and 13% in a Morning: Why the S&P 500 and Nasdaq Closed Lower While Energy Led Every Sector
On 12 November 2026 the S&P 500 fell 0.34% to 7,593 and the Nasdaq 0.40% after Nvidia dropped as much as 13% intraday on the news that Jensen Huang had stepped down as chief executive; the stock closed 4.3% lower. Energy rose 1.5%, the best of the eleven sectors and its fourth straight gain, as Brent jumped on Iran's tanker-mine claims. Friday extended the tech slide, with the Nasdaq down 0.91% and Nvidia off 12.75% on the week, yet all three indexes finished the week higher. This guide explains what happened to Nvidia, why one stock can move the index, where the money went, and what the 17 November earnings and the 19 November Anthropic listing mean for the next leg.
Written on 14 November 2026, after the Friday close. Index and stock moves are from published market reports for 12 and 13 November.
The stock market spent the second week of November 2026 learning how much of the S&P 500 is one company. On Thursday 12 November Nvidia fell as much as 13% in the morning session, to $151, after the company announced that Jensen Huang had stepped down as chief executive and its board disclosed a review of a personal relationship. The stock closed 4.3% lower after a recovery through the afternoon. That was enough: the S&P 500 fell 0.34% to 7,593, the Nasdaq 0.40% and the Dow 0.36%, even though energy, the best of the eleven sectors, rose 1.5% for a fourth straight gain as Brent jumped 3.3% on Iran's claim that four tankers had struck mines in the Strait of Hormuz. One stock outweighed one sector. Friday added to it: the Nasdaq fell 0.91%, the S&P 500 0.40%, Nvidia another 2% to finish the week 12.75% lower, and HSBC cut the shares to Hold. All three indexes still closed the week higher than they started it, which tells you how strong the first half of the week had been. This guide explains what happened to Nvidia, why one company can move the whole index, where the money rotated, and what the next two events, Nvidia's earnings on 17 November and the Anthropic listing on 19 November, mean for the next leg. The Nasdaq 100 guide covers the index mechanics; this is the week.
The session in numbers
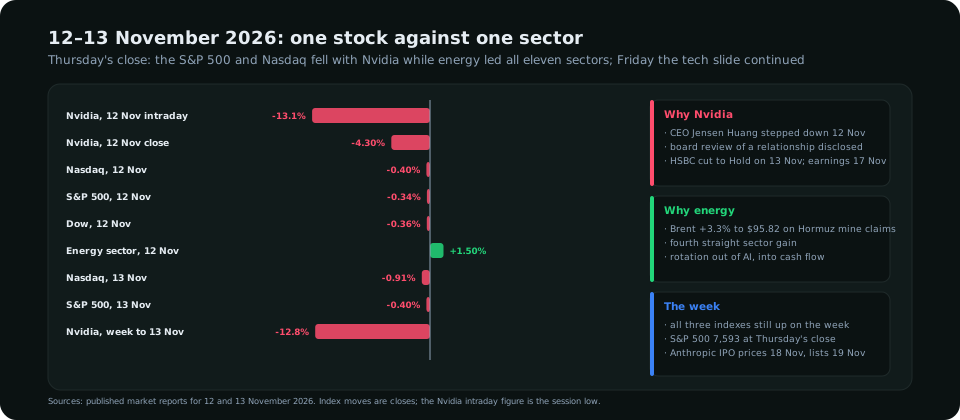
| Instrument | 12 Nov | 13 Nov | Why |
|---|---|---|---|
| Nvidia | −13.1% intraday, −4.3% close | ≈−2%; −12.75% on the week | CEO exit; board review; HSBC downgrade to Hold |
| Nasdaq Composite | −0.40% | −0.91% | Nvidia's weight plus de-risking ahead of earnings and the Anthropic IPO |
| S&P 500 | −0.34% to 7,593 | −0.40% | Technology outweighed energy and financials |
| Dow Jones | −0.36% | Higher | Price-weighted; Nvidia is a smaller weight there; energy and cyclicals carried Friday |
| Energy sector | +1.5%, best of eleven | Firm | Brent +3.3% to $95.82 on the Hormuz mine claims; fourth straight sector gain |
| Week | All three indexes higher | Monday to Wednesday's gains outlasted the Nvidia-led slide | |
What happened to Nvidia
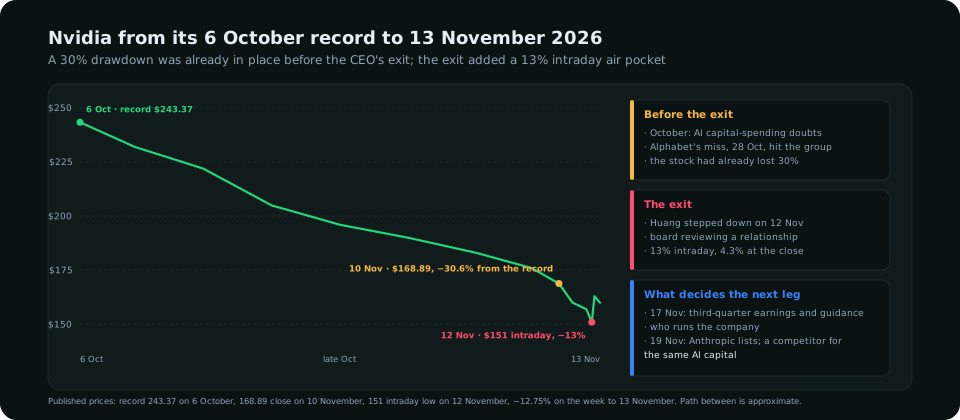
The exit was the trigger, not the trend. Nvidia had already fallen about 30% from its 6 October record of $243.37 to $168.89 by 10 November, in a drawdown that began with the market's turn against AI capital spending and accelerated after Alphabet's revenue miss on 28 October raised the question of whether the companies buying Nvidia's chips were being paid back. The Alphabet-day guide covered that first leg. Thursday's news changed the character of the decline from a valuation debate into a governance one, which is why the first reaction was an air pocket rather than an orderly repricing: a 13% intraday fall followed by a recovery to a 4.3% loss is a market that sold first and read the statement second. Three things are now unresolved and the market has priced none of them with confidence: who runs the company, what the board's review finds, and whether the third-quarter numbers and guidance on 17 November show the demand that justifies the capital spending the whole sector depends on.
Why one stock moves the index
- Weight. The S&P 500 and the Nasdaq 100 are weighted by market value, and Nvidia is among the largest companies in the world even after a 30% fall. A 4% move in a stock with a 6–7% index weight is a quarter of a percent of the index on its own, before any sympathy selling in the chip and AI complex.
- Correlation. The AI trade is one trade expressed through many tickers. When its largest expression falls on company-specific news, the market treats it as information about the trade, and the others fall with it. Thursday's chip-sector sell-off was broader than Nvidia.
- The Dow is different. Price-weighted, thirty stocks, and Nvidia's share price is modest next to the high-priced industrials and financials. That is why the Dow rose on Friday while the Nasdaq fell nearly 1%, the same split the late-October guide described.
Where the money went
Energy's fourth consecutive gain is the other half of the week. Brent had fallen about a third from its mid-October peak on hopes that the Iran war was ending, and the mine claims of 12 and 13 November put a floor under the price at a moment when investors were looking for somewhere to put money that was leaving AI. Energy stocks offer the opposite profile to the Nasdaq's leaders: short duration, cash flow now, a dividend, and a commodity price with a geopolitical floor. The Hormuz guide covers the oil side. The rotation is not yet a trend; a sector can lead for four days inside a market that is still, on the week, up. But it is the trade the market reaches for every time the AI complex wobbles, and it is worth knowing where it goes.
The macro backdrop pushed the same way. October CPI on 10 November printed hot enough to make a December Fed hike a certainty and put a half-point on the table, which raises the discount rate on exactly the long-duration earnings the Nasdaq's leaders represent. The CPI guide covers the release; the yields guide covers why a 10-year at 5.15% is a headwind for growth stocks and a tailwind for energy and financials.
The next two events
| Date | Event | What decides the reaction |
|---|---|---|
| 17 Nov, after the close | Nvidia third-quarter earnings | Data-centre revenue and the guide; any comment on leadership; the market needs a reason to believe the capital spending is being paid back |
| 18–19 Nov | Anthropic prices and lists (Nasdaq: ANT) | About $64 billion raised at $70–78 a share, roughly six times oversubscribed; a successful debut validates the AI trade and competes for the same capital; a weak one confirms the fatigue |
| Week of 16 Nov | FOMC minutes, retail sales | Any sign the Committee discussed 50 basis points in October |
| 25 Nov | Q3 GDP second estimate | Nominal growth supports earnings; the question is the rate used to discount them |
How to trade it
- Index traders: the Nasdaq–Dow spread is the week's expression. Long Dow against short Nasdaq 100 worked on both Thursday and Friday and is the position that profits from rotation without a view on Nvidia's governance. It loses if earnings on 17 November are strong enough to restart the AI trade.
- Single-stock traders: respect the air pocket. A 13% intraday range followed by a 4% close means stops anywhere inside the range were taken in both directions. Until the earnings are out, the stock trades on headlines, and headline trading is sizing, not analysis.
- Forex traders: the equity link is the yen. A Nasdaq sell-off is risk-off and yen-positive; it is the one force that has pulled USD/JPY back from 160 this autumn, and it did so on 30 October. A weak Nvidia print on 17 November is a USD/JPY event as much as an equity one; the intervention-watch guide covers the levels.
- Everyone: the first candle after each event is the range, not the direction. The risk management rules set the size; the psychology guide covers not trading the headline you have just read.
What to read in the terminal
The terminal's macro-regime panel scores risk appetite from the dollar, yields and the equity indexes together, and it moved toward risk-off on 12 November for the first time since the late-October Alphabet session; the intermarket read shows the Nasdaq 100's correlation with USD/JPY and with the 10-year yield, both of which are at the tight end of their ranges. Symbol Analysis covers the NAS100 and US500 CFD markets alongside the forex pairs, with the same positioning, seasonality and volume reads; the feature tour shows them, the live sessions walk through the week's index setups, and all of it is part of the plans on the pricing page.
Frequently asked
Why did the stock market fall on 12 November 2026?
Nvidia fell as much as 13% intraday and 4.3% at the close after chief executive Jensen Huang stepped down and the board disclosed a review of a personal relationship. Nvidia's weight in the S&P 500 and Nasdaq, and sympathy selling across the chip sector, outweighed a 1.5% gain in energy stocks. The S&P 500 closed down 0.34% at 7,593 and the Nasdaq down 0.40%.
Why did energy stocks rise while technology fell?
Brent crude rose 3.3% to $95.82 after Iran said four tankers had struck mines in the Strait of Hormuz, lifting energy shares for a fourth straight session, and money leaving the AI trade rotated toward sectors with near-term cash flow and a commodity floor.
How far has Nvidia fallen from its high?
From a record of $243.37 on 6 October 2026, the shares had fallen about 30% to $168.89 by 10 November before the CEO news; the 12 November intraday low was $151, and the stock lost 12.75% in the week to 13 November.
What should traders watch next?
Nvidia's third-quarter earnings after the close on 17 November, Anthropic's IPO pricing on 18 November and Nasdaq debut on 19 November, the FOMC minutes and retail sales next week, and the second estimate of third-quarter GDP on 25 November.
Everything on SMC Terminal is analysis and education, not a recommendation to buy or sell. Prices and index levels are from published market reports for 12 and 13 November 2026 and change continuously. Trading carries a substantial risk of loss. Manage your risk.