US GDP Grew 3.4% in the Third Quarter: Where the Growth Came From and Why It Still Leaves the Fed Hiking
The Bureau of Economic Analysis's advance estimate put US real GDP growth at 3.4% annualised in the third quarter of 2026, up from 2.2% in the second, with real final sales to private domestic purchasers up 4.9%. Consumer spending, inventories, equipment and federal spending added; exports fell and imports rose. The quarter's own inflation measures cooled sharply even as the monthly data re-accelerated. This guide breaks the report down component by component, explains the apparent contradiction between a 2.1% quarterly PCE price index and a 3.1% September core PCE, sets out what it means for the Fed, the dollar and yields, and what the 25 November second estimate could change.
Written on 14 November 2026. Figures are from the Bureau of Economic Analysis's advance estimate of 29 October; the second estimate is due on 25 November.
US GDP grew at an annual rate of 3.4% in the third quarter of 2026, the Bureau of Economic Analysis said in its advance estimate on 29 October, up from 2.2% in the second quarter and a little above the 3.2% consensus and the Atlanta Fed's 3.3% nowcast. It was the strongest quarter of the year, it arrived the morning after the Federal Reserve had upgraded its description of the economy from "solid" to "strong", and it landed alongside a September PCE report showing core inflation at 3.1% and rising. The headline is simple. The composition is not, and the composition is what decides whether 3.4% is a number the Fed hikes into or a number that revises away. This guide breaks the report down component by component, explains why the quarter's own inflation measures cooled while the monthly data heated up, sets out what it means for the Fed, the dollar and Treasury yields, and describes what the second estimate on 25 November can change. The preview written before the release set out what to look for; this is what was found.
The headline numbers
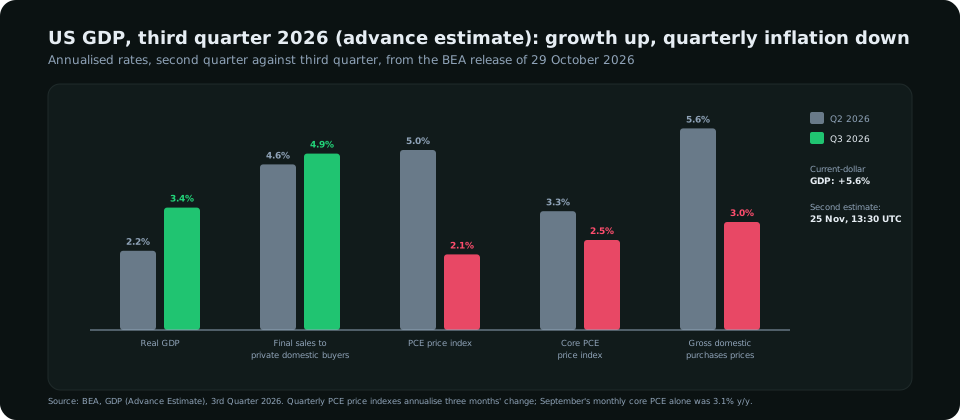
| Measure (annualised) | Q2 2026 | Q3 2026 | Read |
|---|---|---|---|
| Real GDP | 2.2% | 3.4% | Acceleration; the best quarter of the year |
| Real final sales to private domestic purchasers | 4.6% | 4.9% | Consumer spending plus private fixed investment: the private economy's own momentum, stronger still |
| Current-dollar GDP | — | 5.6% | Nominal growth; the number tax receipts and corporate revenues follow |
| Gross domestic purchases price index | 5.6% | 3.0% | Inflation of everything bought in the US, including imports; sharply lower |
| PCE price index | 5.0% | 2.1% | Consumer prices inside the quarter; the energy spike of the spring fell out |
| Core PCE price index | 3.3% | 2.5% | Lower on the quarter, but the monthly path within it turned up |
Where the growth came from
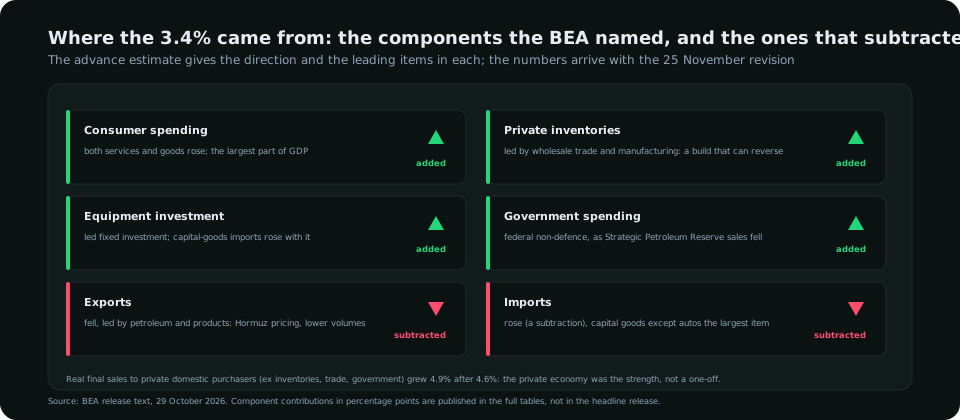
- Consumer spending rose, with gains in both services and goods. This is roughly two-thirds of GDP and the component that has to hold for the expansion to hold. With payrolls up 165,000 in October and wages growing 3.1% a year against headline inflation of 3.6%, real incomes are flat to slightly negative, which makes the strength in spending a drawdown of savings and an increase in credit as much as a rise in income. It is real growth; it is not costless growth.
- Private inventory investment rose, led by wholesale trade and manufacturing. Inventory building adds to GDP in the quarter it happens and subtracts in the quarter it unwinds, and the advance estimate's inventory figure is built on incomplete September data. This is the component most likely to be revised and the reason economists quote final sales alongside the headline.
- Equipment investment rose and led fixed investment. Much of it is the data-centre and AI build-out that has dominated corporate capital spending all year; the same build-out shows up in imports.
- Government spending rose, mainly federal non-defence consumption, and the BEA attributes the increase to lower sales from the Strategic Petroleum Reserve. SPR sales count as negative government consumption, so selling less of the reserve raises measured spending; it is an accounting effect of the oil shock rather than a fiscal expansion.
- Exports fell, led by petroleum and petroleum products. With Brent above $110 and the Strait of Hormuz disrupted, US crude exports are worth more per barrel but volumes have been constrained; the oil shock that has driven inflation also took growth away through trade.
- Imports rose, with capital goods excluding autos the largest contributor. Imports subtract from GDP arithmetically, but imports of capital goods are a sign of investment demand rather than weakness.
Put together: the private economy grew faster than the headline, the headline was helped by inventories and an accounting quirk in government spending, and trade subtracted. Real final sales to private domestic purchasers at 4.9% is the number to remember, and it was higher than the second quarter's 4.6%.
Why the quarter's inflation cooled while the months heated up
The report's price indexes look reassuring: PCE prices up 2.1% annualised and core 2.5%, against 5.0% and 3.3% in the second quarter. The same morning's monthly PCE report showed September core inflation at 3.1% year on year and rising. Both are correct, and the difference is arithmetic. The quarterly index compares the average price level of July to September with that of April to June, annualised. The spring quarter carried the first and largest leg of the energy shock, so the quarter-on-quarter comparison is flattered by a high base. The monthly series shows what happened inside the quarter: core prices rose 0.3% in September and have risen at that pace or faster since, which is a 3.5–4% annualised run rate. The Fed sets policy on the monthly path, not the quarterly average, and the monthly path is why a 2.1% quarterly PCE figure did nothing to lower December hike odds. The statement guide covers why the Committee had already decided the economy was strong before it saw this report.
What it means for the Fed, yields and the dollar
| Market | Effect | Why |
|---|---|---|
| Fed policy | Confirms the December hike; raises the bar for stopping | Growth at 3.4% with final private sales at 4.9% removes any argument that tightening is already slowing the economy; the Committee can hike without fearing it is hiking into weakness |
| Treasury yields | Higher, especially the long end | Stronger nominal growth (5.6%) means higher nominal yields are sustainable; the 10-year has risen from 5.04% on Fed day to 5.15% and the 30-year to 5.48%. The yields guide covers the split and the resolution |
| US dollar | Supported | Growth differentials now point the same way as rate differentials: the US at 3.4% against a euro area publishing its own third-quarter figure in the low single digits and a Japan still at 1.25%. The dollar index is at 103.4, its highest since April 2025 |
| Equities | Split | Strong nominal growth supports earnings; higher yields compress multiples. Cyclical and financial sectors take the first; long-duration growth stocks take the second |
| Gold | Negative | Strong growth with elevated inflation is a hiking regime; gold fell to a one-year low on 12 November |
The fundamentals guide explains the ranking: for a currency, the growth number matters in proportion to what it does to the expected policy rate, and this one did a lot. The economic-data guide covers how a release that confirms a priced expectation still moves the market, through the revisions and the composition rather than the headline.
What the 25 November revision can change
The second estimate, published with corporate profits on 25 November at 13:30 UTC, replaces the BEA's assumptions for September's inventories, trade and construction with the actual data. Revisions of half a percentage point in either direction are common at this stage, and the components most likely to move are the ones that were most assumed: inventories (which could take the headline down) and consumer services (which have been revised up more often than down this year). A revision to 3.0% would not change the Fed's December decision; a revision to 4.0% would strengthen the case for a half-point move. The third estimate follows in late December, after the FOMC has met.
What to read in the terminal
The Macro Economics module shows the US regime as growth against inflation, with the latest GDP, payrolls, CPI and PCE prints feeding a single classification; it has read "expansion with elevated inflation" since the September PCE report and will update on the 25 November revision automatically. The red-events panel on Home lists the revision, the October PCE report, the 4 December payrolls and the 9 December FOMC with countdowns and consensus figures, and Symbol Analysis carries the regime into every dollar pair's verdict. The module is part of every plan on the pricing page; the economic calendar guide covers how to prepare for the releases it tracks.
Frequently asked
How much did US GDP grow in the third quarter of 2026?
Real GDP grew at an annual rate of 3.4% according to the BEA's advance estimate of 29 October 2026, up from 2.2% in the second quarter. Real final sales to private domestic purchasers grew 4.9%, and current-dollar GDP grew 5.6%.
What drove the growth?
Increases in consumer spending (services and goods), private inventory investment (wholesale trade and manufacturing), equipment investment and federal government spending (reflecting lower Strategic Petroleum Reserve sales). Exports fell, led by petroleum, and imports rose, led by capital goods; both subtracted from the total.
Why did the GDP report show lower inflation when monthly inflation is rising?
The quarterly PCE price index (2.1%, core 2.5%) compares the third quarter's average prices with the second quarter's, and the second quarter carried the largest leg of the energy shock, so the base was high. The monthly data show core prices rising 0.3% a month since late summer, a 3.5–4% annualised pace, which is what the Fed responds to.
When is the next GDP estimate and what could change?
The second estimate, with corporate profits, is due on 25 November 2026 at 13:30 UTC. Inventories and trade are the components most likely to be revised; a half-point change in either direction would be ordinary. The third estimate follows in late December.
Everything on SMC Terminal is analysis and education, not a recommendation to buy or sell. Figures are from the BEA's advance estimate and published market reports through 13 November 2026. Trading carries a substantial risk of loss. Manage your risk.