US Dollar Index (DXY): What It Measures and How Traders Use It
The DXY is quoted everywhere and understood rarely. It is a 1973 basket weighted toward the euro, it says nothing about the yuan, and it moves the price of gold, oil and every major pair at once. Here is what the index actually measures, where its weights come from, and the four ways traders put it to work.
"The dollar is up today." Up against what? A currency only has a price against another currency, so any statement about the dollar needs a basket. The US Dollar Index — DXY, "the Dixie" — is the basket most traders mean. It was created by the Federal Reserve in 1973 after the end of fixed exchange rates, set to 100 at the start, and it has been quoted continuously since. It is the most-watched single number in foreign exchange, and most of the people watching it could not say what is in it.
What is in the basket
Six currencies, with fixed weights that have changed once (when the euro replaced the German mark, French franc and others in 1999). The weights are geometric — the index is a product of the six exchange rates raised to their weights — which means a 1% move in the euro contributes about 0.58% to the index regardless of the level.
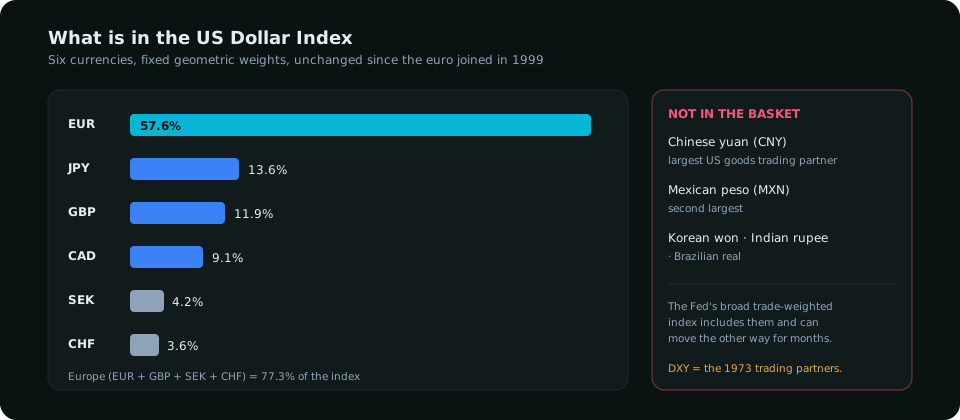
| Currency | Weight | Why it is there |
|---|---|---|
| Euro (EUR) | 57.6% | Inherited the weights of the mark, franc, lira, guilder and Belgian franc |
| Japanese yen (JPY) | 13.6% | 1973 trade shares |
| British pound (GBP) | 11.9% | |
| Canadian dollar (CAD) | 9.1% | |
| Swedish krona (SEK) | 4.2% | A legacy of 1973 trade patterns |
| Swiss franc (CHF) | 3.6% |
What is not in it tells you as much: no Chinese yuan, no Mexican peso, no Korean won — three of the United States' largest trading partners today. The Fed's own trade-weighted dollar index includes them and moves differently. The DXY measures the dollar against the currencies that mattered to the dollar fifty years ago, which happen to be the ones that trade most freely, which is why the market kept it.
What moves it
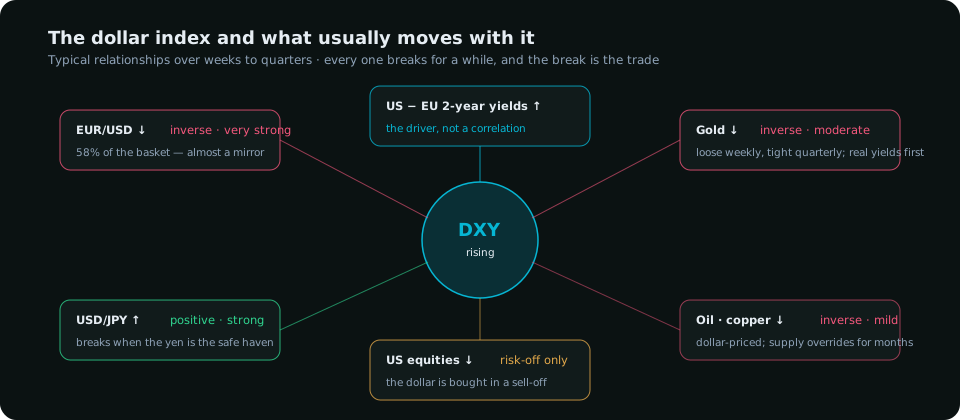
- Interest-rate expectations. Not the Fed's current rate but where the market expects it to be in a year, relative to the same expectation for the ECB, BoJ and BoE. The 2-year yield differential between the US and Germany tracks the DXY more closely than any other single series.
- Real yields. Nominal yields minus expected inflation. When US real yields rise faster than Europe's, capital moves into dollars.
- Risk appetite. In a sell-off the dollar is bought as the funding currency and the safe asset; a strong DXY on a red equity day is normal. The yen and franc share this role, which is why the DXY's safe-haven bounce is smaller than the dollar's bounce against the Australian dollar.
- Positioning. The dollar index has its own futures contract (DX on ICE) with a CFTC report, and speculators crowd it like any other market. A record net long in DX is a crowded dollar trade. The COT report for forex explains the read.
How traders use it
1. As the dollar leg of every pair
Every major pair is "something against the dollar". A trader deciding on EUR/USD is making two calls — one on the euro, one on the dollar — and the DXY isolates the second. If the DXY is in a clean daily uptrend, every XXX/USD pair has a headwind and every USD/XXX a tailwind, before you know anything about the other currency. That is the first filter: trade with the DXY's direction unless the other currency has a stronger story of its own.
2. As a divergence tool
Because the index is 58% euro, EUR/USD and DXY normally mirror each other almost exactly. When they stop — EUR/USD makes a new high but the DXY does not make a new low — one of two things is happening: the yen or the pound is moving hard, or the euro move is thin. Either way the divergence is information. The classic use: a new high in EUR/USD that the DXY does not confirm is a high to be suspicious of, especially if it sweeps obvious liquidity.
3. As a driver for gold, oil and indices
Gold is priced in dollars and competes with dollar assets for the same capital, so a rising DXY weighs on it — the relationship is loose over days and tight over quarters. Oil and copper are also dollar-priced. Emerging-market equities carry dollar debt. A trader on any of these markets watches the DXY as a driver; the gold guide puts it second among the metal's drivers, after real yields.
4. As a chart in its own right
The DXY has structure like any market and is traded through the DX future, dollar ETFs and CFDs. Its levels are watched by enough participants to matter: a break of a multi-month DXY range tends to show up in every dollar pair within the same session.
Reading it without being fooled
- It is not the "strength of the US economy". It is the dollar's exchange rate against six currencies. A recession in Europe lifts the DXY; a boom in the United States that pulls in imports can weaken it.
- A flat DXY can hide a lot. The euro down 1% and the yen up 4% on the same day nets to a small index move while USD/JPY has collapsed. Check the components when the index is quiet and the pairs are not.
- Round numbers matter more than they should. 100 and 105 have been fought over for decades; options barriers and media attention make them real levels. Treat them as liquidity pools in the SMC sense.
- The daily is the timeframe. The DXY's useful signal is its direction over days and weeks. On a five-minute chart it is just EUR/USD with the sign flipped.
A practical routine
Once a day, before the London open: note the DXY's position relative to its 50-day average and its last daily swing, check whether the 2-year yield differential moved the day before, and glance at the dollar's own COT percentile on the weekend. Three facts, which give you the dollar's bias for the day. Then every pair you look at inherits that bias as its starting point, and the pair's own story has to be strong enough to override it. That is the entire use of the index — not a signal, but the half of every forex decision that most traders never make explicitly.
Everything on SMC Terminal is analysis and education, not a recommendation to buy or sell. Index weights are those published by ICE; relationships described are typical, not guaranteed. Trading carries a substantial risk of loss. Manage your risk.