Real Yields and Gold Prices: Understanding the Relationship
Real yields are the single macro series that explains more of gold's price than any other, because they are the return an investor gives up by holding metal instead of an inflation-protected bond. This guide explains what a real yield is, where to read it, why gold moves inversely to it, the periods when the link breaks and why, and how to use it as a daily bias input rather than a forecast.
Gold pays nothing. An inflation-protected government bond pays a real yield: a return above inflation, guaranteed. So the real yield is the price of holding gold, the income an investor forgoes by owning metal instead of the bond, and when that price rises gold tends to fall, and when it falls gold tends to rise. Of all the macro series traders overlay on a gold chart, this one has the longest record of explaining the trend, and it is also the one most often read wrongly: as a level rather than a change, as a law rather than a tendency, and without noticing the years in which it stopped working. This guide covers what real yields are, where to read them, how to turn them into a daily bias input, and the conditions under which they should be set aside.
What a real yield is
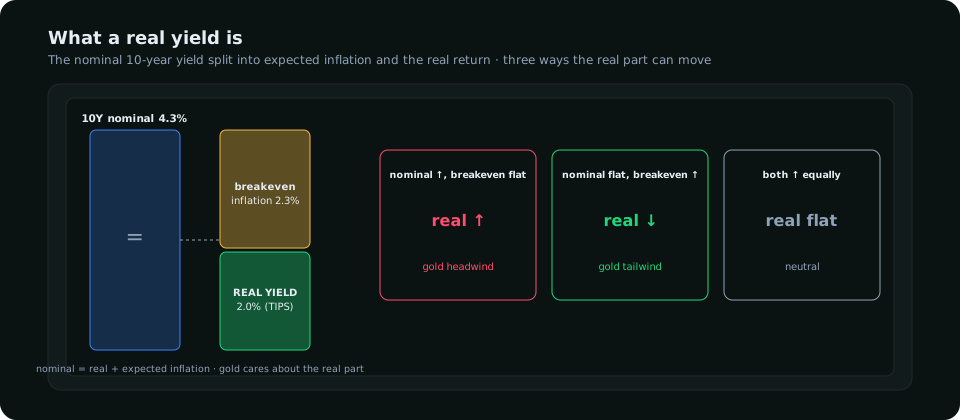
A 10-year Treasury yielding 4.3% when the market expects 2.3% inflation over those ten years offers a real return of about 2.0%. That 2.0% is observable directly as the yield on 10-year Treasury Inflation-Protected Securities (TIPS), published daily by the US Treasury and on FRED as DFII10, and the 2.3% is the breakeven, the gap between the nominal and TIPS yields. The decomposition matters because the headline yield can rise for two reasons with opposite implications for gold: because real returns are rising (bad for gold) or because inflation expectations are rising (good for gold, since the metal is the inflation hedge the bond is pricing). Traders who watch only the 10-year nominal yield will be surprised by gold rallying into rising yields; traders who watch the real yield will not.
Why gold moves inversely
Three mechanisms stack. The opportunity cost argument above: a higher real yield makes a zero-yield asset less attractive relative to a guaranteed real return. The dollar: higher US real yields pull capital into dollars, and gold is priced in dollars, so a stronger dollar lowers its price in dollar terms. And positioning: macro funds run gold against real yields as a model trade, so the correlation partly enforces itself, with funds selling gold when TIPS yields rise regardless of anything else. From 2006 to 2021 the 10-year real yield explained roughly three-quarters of the variation in gold's price on a monthly basis; its rise from −1.1% in 2021 to +1.5% in 2022 coincided with gold's stall below 2,100 despite the highest inflation in forty years.
Reading it day to day
| 10-year real yield, 5-day change | Dollar index, 5-day | Gold bias input | Note |
|---|---|---|---|
| Falling (−10 bp or more) | Falling | Bullish | Both tailwinds; dips are buys |
| Falling | Rising | Mildly bullish | Real yields usually win; watch the dollar's reason |
| Rising (+10 bp or more) | Rising | Bearish | Both headwinds; rallies into supply are sells |
| Rising | Falling | Two-way | Conflict; reduce size or wait |
| Flat | Flat | Neutral | Chart and positioning decide |
The change is the input, not the level. A real yield of 2.0% is neither bullish nor bearish on its own; a real yield that moved from 1.8% to 2.0% this week is a headwind. Ten basis points over five days is a reasonable threshold for "moving"; day-to-day noise is smaller than that. SMC Terminal's Valuation & Yields tab shows the real yield and dollar reads together for this reason, and the Treasury yields article covers the mechanics of the yields themselves.
When the relationship breaks
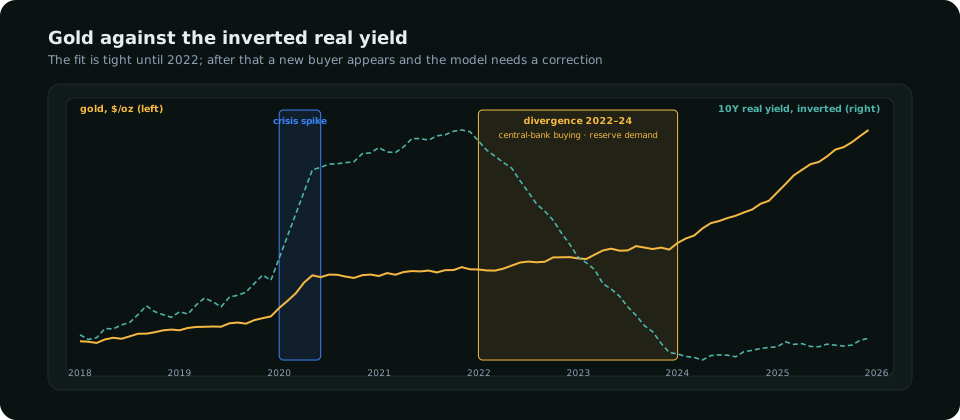
From 2022 the model's fit deteriorated badly. Real yields rose from deeply negative to above 2% and gold, which should have fallen by hundreds of dollars, instead consolidated and then made new highs. The reason was a buyer who does not care about real yields: central banks, whose purchases doubled after 2022 as several reserve managers reduced their dollar exposure following the freezing of Russian reserves. That demand is not a function of TIPS yields, and it was large enough to offset the macro-fund selling the model predicted. Two other breaks are recurrent: crisis demand (March 2020, bank-stress episodes), when gold rallies on fear regardless of yields, and dollar-driven moves, when the dollar falls for its own reasons and lifts gold in dollar terms even as real yields are flat.
The practical rule: when real yields and gold diverge for more than a few weeks, do not assume gold will "catch down". Ask who is buying. If the answer is official-sector demand or a flight to safety, the real-yield read is demoted to a secondary input until that demand fades. The dollar and gold article treats the same question for the dollar.
Using it in a plan
- Each morning, note the 10-year real yield's five-day change and the dollar index's.
- Set the macro bias input from the table above.
- Check whether gold has followed over the past two weeks. If it has, the read is live; if gold has ignored a 20 bp rise, the model is in a divergence and the input is downgraded.
- Combine with positioning (the COT read) and the daily structure; the real-yield input is one vote, not the decision.
- Around FOMC and CPI, expect the real-yield move to happen in minutes and gold to respond within seconds; do not hold a position into those releases on the strength of the model.
The gold price analysis guide places this input alongside the others; the interest rates article explains how policy expectations feed into the nominal yield in the first place.
Frequently asked
Which real yield should I watch for gold?
The 10-year TIPS yield (FRED series DFII10). The 5-year is more sensitive to policy and moves more; the 10-year has the longest record against gold and is what the model trades use.
Do rising yields always mean lower gold?
No. Rising nominal yields driven by inflation expectations leave the real yield flat and gold unaffected or higher. And since 2022 even rising real yields have been offset by central-bank demand. Read the real component and check whether gold is actually following.
Is the gold–real yield relationship dead?
Weakened, not dead. The direction of the daily and weekly moves still lines up most of the time; the level relationship (where gold "should" be for a given real yield) broke in 2022 and has not been restored.
Everything on SMC Terminal is analysis and education, not a recommendation to buy or sell. Figures in the example are illustrative. Trading carries a substantial risk of loss. Manage your risk.