Candlestick Patterns Explained: Doji, Engulfing, Hammer, Pin Bar, Head and Shoulders, Double Tops, Flags, Wedges and Triangles
Candlestick patterns are the market's shorthand for who won the fight inside one or a few candles; chart patterns are the same story over weeks. This guide covers the nine that traders actually use, the doji, engulfing candle, hammer and pin bar, head and shoulders, double top and bottom, bull flag, wedge and triangle, with what each one measures, where it is worth trading and where it is noise, and the one rule that makes all of them work: location first, pattern second.
Candlestick patterns compress one piece of information into a shape: over the life of the candle, who was in control and who gave up. A long lower wick says sellers pushed price down and buyers took it all back; a tiny body says neither side could move it. Chart patterns tell the same story over weeks rather than hours, as the shape a sequence of swings makes. Both are useful and both are misused in the same way: traded wherever they appear, instead of only where they appear at a level that matters. This guide covers the four single-candle patterns and five chart patterns traders actually use, what each measures, how to set the stop, and the location rule that separates the ones that work from the ones that fill a journal with small losses.
The one rule: location first, pattern second
A hammer in the middle of a range is a candle. A hammer at a daily demand zone after a sweep of the lows is a trade. Every pattern below is a confirmation that a level is reacting, not a signal in itself, and the level comes from the support and resistance and trend reads done before the pattern is looked for. Traders who scan thirty charts for hammers find thirty hammers and no edge; traders who mark three zones and wait for a hammer at one of them find a few setups a week and an edge. Keep that order throughout.
Single-candle patterns
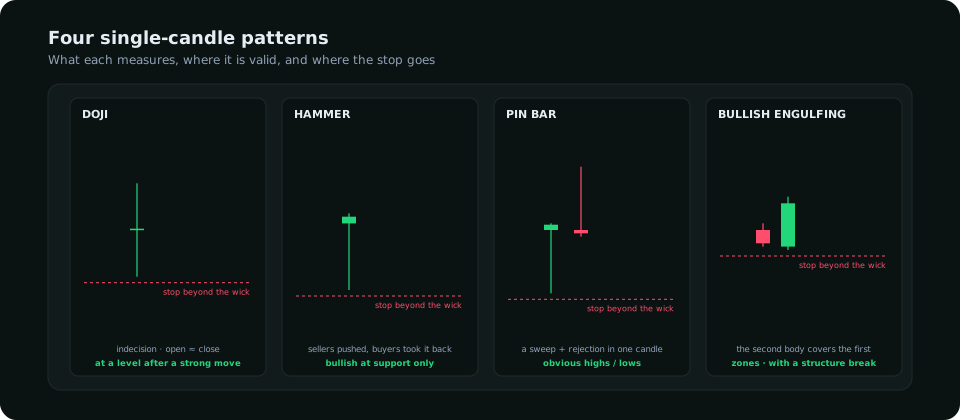
Doji candle
A doji opens and closes at nearly the same price, leaving a body that is a line and wicks on one or both sides. It measures indecision: both sides traded and neither finished ahead. On its own it predicts nothing, and a chart has dozens of them. A doji earns attention in two places: at the end of a strong move into a level, where it is the first candle in a while that the trend could not push through, and as the middle candle of a three-candle reversal (a morning or evening star). The trade is never the doji itself but the candle after it; a doji at resistance followed by a wide red close is the signal, a doji followed by another doji is a range.
Hammer candlestick
A hammer has a small body near the top of its range and a lower wick at least twice the body's height. Sellers drove price down during the candle and buyers reversed all of it before the close. It is bullish only at support: at a demand zone, after a sweep of a prior low, in the discount half of the range. The same shape in the middle of nowhere is a candle with a wick. Its inverted form (small body at the bottom, long upper wick) at resistance is the bearish equivalent, a shooting star. Stop beyond the wick's low; the wick is where the sellers were absorbed, and a close below it means they were not.
Pin bar
The pin bar is the hammer's general case: any candle with a wick at least two-thirds of its range that pokes through a level and closes back on the other side. The wick is the "pin" into the level; the close back is the rejection. In smart money terms it is a liquidity sweep completed inside a single candle, which is why pin bars at obvious highs and lows work and pin bars elsewhere do not. Entry on the close or on a 50% retrace of the candle; stop beyond the wick; target the opposite side of the range or the next zone. Pin bars on the daily and four-hour charts carry weight; on the five-minute chart every third candle is one.
Engulfing candle
A bullish engulfing is a red candle followed by a green candle whose body opens at or below the red body's close and closes above its open, covering it entirely. The second candle reverses everything the first did and more, which makes it the strongest single-candle signal of a change in control. The bearish version is the mirror. Two refinements: the engulfing body should be large relative to recent candles (a displacement, not a technicality), and it should engulf at a level. An engulfing candle that also breaks a minor swing is a break of structure and a candlestick pattern at once. Stop beyond the low of the pattern; first target the next swing.
| Pattern | Measures | Valid where | Stop | Timeframes |
|---|---|---|---|---|
| Doji | Indecision; a pause in the trend | At a level after a strong move; as the middle of a star | Beyond the candle after it | H4, D1 |
| Hammer / shooting star | Rejection of lower / higher prices | Support for the hammer, resistance for the star | Beyond the wick | H1 and above |
| Pin bar | A sweep and rejection in one candle | Obvious highs and lows, zone edges | Beyond the wick | H4, D1 strongest |
| Engulfing | A change of control with displacement | Zones; with a minor structure break | Beyond the pattern's extreme | H1 and above |
Chart patterns
Head and shoulders pattern
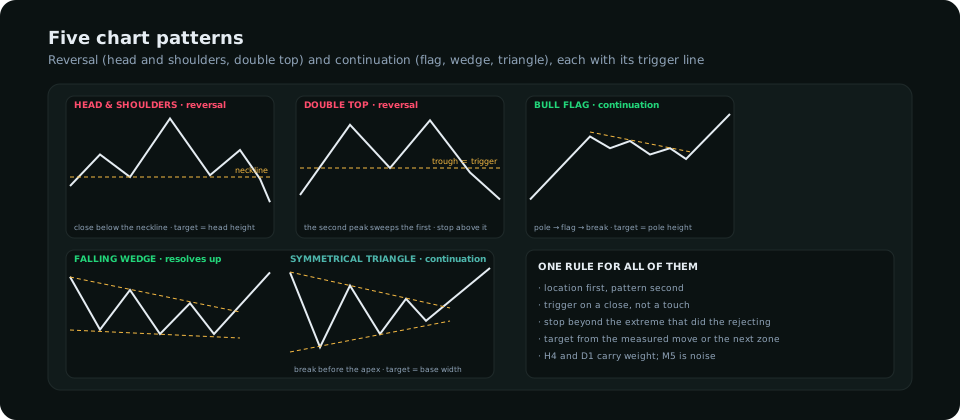
Three peaks with the middle one highest, and a neckline drawn under the two troughs between them. It is a reversal pattern because it is a higher high (the head) followed by a lower high (the right shoulder): the trend's last attempt failed, and in swing-point terms the right shoulder is the first lower high. The trigger is a close below the neckline, not a touch; the stop is above the right shoulder; the measured target is the height from head to neckline projected down from the break. The inverse version at a low is the bullish mirror. The pattern's real edge is that it is a structural reversal; traders who draw head-and-shoulders shapes inside ranges, where there is no trend to reverse, are drawing noise.
Double top and double bottom
Two highs at about the same level with a trough between them. The second high is usually a sweep of the first by a few pips, because the stops above the first high are the point; the pattern completes when price closes below the trough. The double bottom is the mirror and is one of the most reliable reversal patterns in forex when it forms at a daily demand zone with the second low sweeping the first. Stop beyond the second extreme; target the pattern's height projected from the trough. Equal highs or lows that have not yet been swept are not a double top; they are a liquidity pool, and the sweep is what comes next.
Bull flag pattern
A steep impulse (the pole) followed by a tight, slightly downward-sloping consolidation (the flag) of overlapping candles with shrinking range. It is a continuation pattern: the pullback is corrective, as the trend guide describes, and the trade is the break above the flag's upper line, with the stop below the flag's low and the target equal to the pole's height projected from the break. A bear flag is the mirror. The pattern fails when the "flag" retraces more than about half the pole, which is no longer a flag but a possible reversal, and when the break comes on a doji rather than a displacement candle.
Wedge pattern
Two converging trend lines sloping in the same direction. A falling wedge (both lines sloping down, converging) resolves upward more often than not and is bullish whether it appears as a reversal at a low or a continuation in an uptrend; a rising wedge is the bearish mirror. The logic is momentum: each push in the wedge's direction travels less than the last, and the converging lines make that visible. Trigger on a close through the line against the wedge's slope; stop beyond the last swing inside the wedge; target the wedge's widest point projected from the break. Wedges are also where the RSI divergence most often appears, since both measure the same shrinking momentum.
Triangle pattern trading
Converging lines with opposite slopes (symmetrical), or one flat line and one converging (ascending with a flat top, descending with a flat bottom). A triangle is a contracting range, and the trade is the break, usually in the direction of the trend that preceded it; ascending triangles lean bullish because the flat top is a liquidity pool buyers keep testing, descending triangles the reverse. Two rules save most triangle trades: wait for the close beyond the line (the first poke is a sweep about as often as a break), and expect the break in the final third of the triangle, not at the apex, where the range has become too small to carry a move.
| Pattern | Type | Trigger | Stop | Target |
|---|---|---|---|---|
| Head and shoulders | Reversal | Close below the neckline | Above the right shoulder | Head-to-neckline height from the break |
| Double top / bottom | Reversal | Close beyond the middle trough / peak | Beyond the second extreme | Pattern height from the trough |
| Bull / bear flag | Continuation | Close out of the flag | Beyond the flag's extreme | Pole height from the break |
| Wedge | Either; resolves against its slope | Close through the line against the slope | Beyond the last swing inside | Widest point from the break |
| Triangle | Continuation, usually | Close beyond the line, before the apex | Beyond the last swing inside | Base width from the break |
How the patterns relate to smart money concepts
Most of these patterns are older names for the same events smart money traders describe differently. A pin bar is a sweep and rejection; a double top's second peak is a liquidity grab of the first; a head and shoulders is a change of character; a flag is a pullback to an order block or fair value gap after displacement. Knowing both vocabularies helps, because the pattern names tell you the shape to look for and the smart money reading tells you why it works and therefore when it will not: a pin bar with no stops beyond its wick had nothing to sweep, and a flag with no imbalance beneath it has nothing to pull back into.
Testing your patterns
Pattern recognition is the easiest thing in trading to fool yourself about, because the eye finds shapes in noise. Pick two patterns, define them mechanically (wick at least two-thirds of range; second body engulfs the first's open and close; close below a neckline drawn through two troughs), add the location rule, and log a hundred of them as the backtesting guide describes. Most traders find that pin bars and engulfing candles at daily zones carry a real edge, that flags in trends do, and that the rest work only when they coincide with one of those. That is a shorter list than the textbooks give, and a more profitable one.
Frequently asked
Which candlestick pattern is the most reliable?
The engulfing candle and the pin bar at a daily or four-hour level, because both describe a completed rejection with displacement. Neither is reliable away from a level.
Do chart patterns work in forex?
The ones that describe structure (head and shoulders, double tops and bottoms, flags) do, because they are trend changes and pullbacks under another name. They work best on the daily and four-hour charts and worst below fifteen minutes.
Where should the stop go on a candlestick pattern?
Beyond the wick or extreme that did the rejecting, plus a small buffer. A stop inside the pattern is a stop at the price the pattern says will not trade again, and it is taken by the next sweep.
Everything on SMC Terminal is analysis and education, not a recommendation to buy or sell. Figures in the example are illustrative. Trading carries a substantial risk of loss. Manage your risk.