Liquidity Sweeps in Forex: How to Identify and Validate Them
A liquidity sweep is the move that takes the stops beyond an obvious level and then reverses — and most of the ones marked on charts are not sweeps at all. This tutorial shows where resting liquidity actually sits, what a real sweep looks like bar by bar, the five validation checks that separate a sweep from a breakout, and how to place the entry and stop once it passes.
Every trader has watched price push a few pips beyond an obvious high, trigger a cluster of stops, and then reverse hard in the other direction — usually with their own stop among the cluster. That move is a liquidity sweep. Understanding it is the difference between being the liquidity and trading it. But the concept has been so over-marked on social-media charts that "sweep" now gets written above every wick. This tutorial is about the mechanics: where resting orders actually sit, what a sweep looks like when it is real, and how to validate one before you risk money on it.
Where liquidity rests
"Liquidity" here means resting orders — stop-losses and pending entries — that will execute if price reaches them. They cluster at places where many traders have made the same decision:
- Above equal highs and below equal lows. Two or three highs within a few pips of each other have stops from everyone who shorted them, plus breakout buy-stops from everyone waiting for the break. This is the densest kind of pool.
- Beyond the previous day's high and low, the previous week's high and low, and the session highs and lows (Asia's range in particular).
- Beyond round numbers — 1.1000, 1.2500, 2,400 on gold — where retail stops cluster by habit.
- Beyond trend-line touches: a third touch of a rising trend line has stops just below it from everyone who bought the line.
Buy-side liquidity sits above highs (buy-stops closing shorts, breakout buys). Sell-side liquidity sits below lows. A large participant who wants to sell a size the market cannot absorb quietly has an interest in price reaching the buy-side pool first: the stops provide the buyers to sell into. That is the whole mechanism, and it is why sweeps so often precede the real move rather than confirm the break.
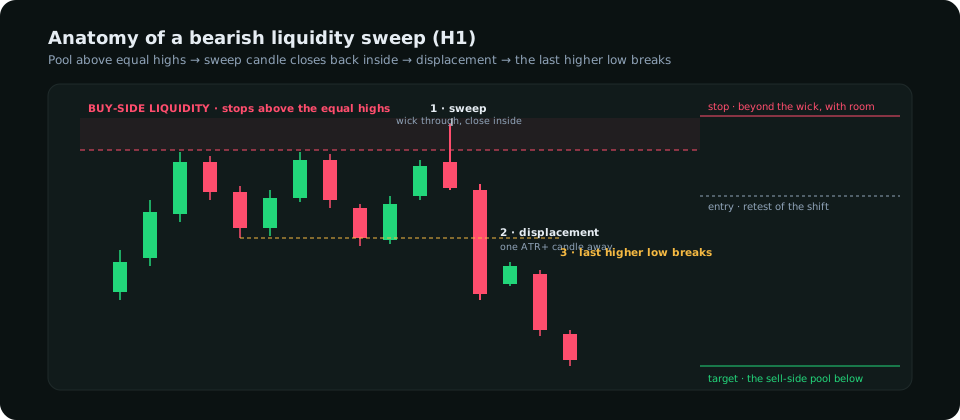
Sweep versus breakout: the bar-by-bar difference
A sweep and a breakout start identically — price trades beyond the level. The difference is in what happens over the next one to three candles.
| Feature | Liquidity sweep | Genuine breakout |
|---|---|---|
| Close of the candle that crosses the level | Back inside the prior range, leaving a wick | Beyond the level, often near the extreme |
| Next one to three candles | Strong move away from the level (displacement) in the opposite direction | Hold beyond the level; shallow pullback that respects it |
| Distance beyond the level | Small — a fraction of an hourly ATR, enough to take the stops | Often larger, and it keeps extending |
| Volume (where visible, e.g. futures) | Spike on the cross, then heavy volume on the reversal | Expanding volume in the direction of the break |
| Short-term structure afterwards | The most recent swing in the sweep's direction is broken | Structure continues in the break's direction |
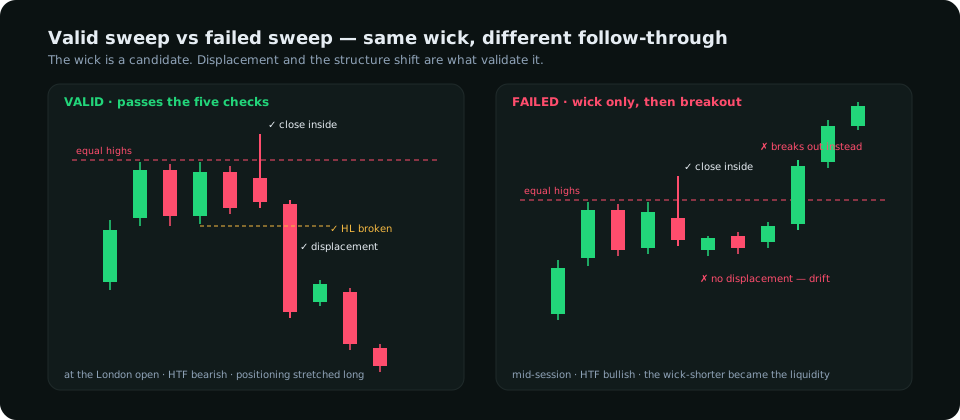
The single most important line in that table is the first one. A close back inside the range is the signature of a sweep. A candle that crosses the highs and closes above them is, until proven otherwise, a breakout — and shorting it because "it must be a sweep" is how traders get run over.
The five validation checks
A wick through a level is a candidate. It becomes a sweep worth trading only when it passes most of these:
- The pool was real. Two or more clear highs (or lows) within roughly 0.2 of the hourly ATR of each other, or a previous-day / session extreme, or a round number. A single untested swing is a weak pool and sweeps of it fail more often.
- The close rejected the level. The crossing candle, or at most the next one, closed back inside. On the hourly chart, wait for the close; a 5-minute wick means nothing until the hour confirms it.
- Displacement followed. Within one to three candles, a candle larger than the recent average (one ATR or more) moved decisively away from the level. Without displacement, the sweep is just a failed break that may try again.
- Timing fits. Sweeps that reverse cluster at the session opens — the London open taking Asia's range, the New York open taking London's morning high or low. A sweep at 03:00 in the dead zone between sessions is far less reliable. The killzones guide covers the windows.
- Context agrees. A sweep of the highs is a short setup; it is a much better short setup when the higher-timeframe structure is bearish, when speculative positioning is stretched long, and when the drivers behind the pair are turning. A sweep against a strong trend with everything else supporting the trend is a pullback entry for the other side, not a reversal.
Entry and stop once a sweep validates
There are three entry styles, trading aggressiveness against confirmation:
| Entry | Where | Trade-off |
|---|---|---|
| Aggressive | At the close of the rejection candle | Best price; takes the trade before displacement proves it |
| Standard | On the break of the most recent opposing swing (the "shift"), or on the retest of the candle that broke it | Worse price; the sweep has proven itself |
| Conservative | On the retest of the first imbalance left by the displacement candle | Often never fills in fast moves; best ratio when it does |
The stop in every case goes beyond the sweep's extreme, with room — not on the equal highs that were swept, which is where the next sweep will reach. On an hourly chart, a stop 0.3 to 0.5 ATR beyond the wick is a sensible default. The target is the opposite pool: the sell-side liquidity below the recent lows for a short, which usually gives a ratio of 2 : 1 or better by construction. The sweep-shift-retest method describes the full sequence.
Common mistakes
- Marking every wick as a sweep. Without a real pool beneath it, a wick is just a wick.
- Entering before the close. A lower-timeframe wick through a level is the moment the sweep is most likely to continue into a breakout. Wait for the hourly close.
- Trading sweeps against the higher-timeframe trend as if they were reversals. In a strong trend, a sweep of the lows is where the trend resumes — buy it, don't sell the highs.
- Stops on the swept level. The next sweep goes a few pips further. Put the stop beyond the wick.
- Ignoring the calendar. A sweep ten minutes before a major US release is noise; the release will decide direction. Check the day's events before trading the sweep.
A practical routine
- Before the session, mark the pools: previous day's high and low, Asia's range, equal highs and lows on the hourly chart, nearby round numbers.
- Note the higher-timeframe bias and the context behind it — the direction a validated sweep would be traded with.
- At the session open, watch for price to reach a pool. Do nothing on the wick.
- On the hourly close back inside, look for displacement within the next three candles.
- Enter on the structure shift or its retest; stop beyond the wick with room; target the opposite pool.
Done this way, sweeps are one of the highest-ratio setups in forex, because the stop is small by construction and the target is where the next cluster of orders sits. Done the social-media way — shorting every wick above a high — they are a reliable way to become the liquidity.
Everything on SMC Terminal is analysis and education, not a recommendation to buy or sell. Trading carries a substantial risk of loss. Manage your risk.