How to Identify a Forex Trend Using Higher Highs and Lower Lows
Forex trend analysis needs no indicator: a trend is a sequence of swing highs and swing lows, and it is read by marking them. This guide gives the rule for what counts as a swing, the three states a market can be in, the one event that ends a trend, how to handle the pullback that looks like a reversal, and how to keep the trend read consistent across daily, four-hour and hourly charts.
Forex trend analysis is usually taught through tools that approximate the trend (moving averages, trend lines, channels) rather than through the trend itself. The trend itself is a sequence of swing points. In an uptrend each swing high is higher than the last and each swing low is higher than the last; in a downtrend the reverse; and when neither holds, the market is in a range. Reading it requires marking the swings and nothing else, and the reading is unambiguous in a way an average's slope never is. This guide gives the rule for what counts as a swing, the three states, the single event that ends a trend, the pullback problem, and how to keep the read consistent from the daily chart down to the hourly.
What counts as a swing
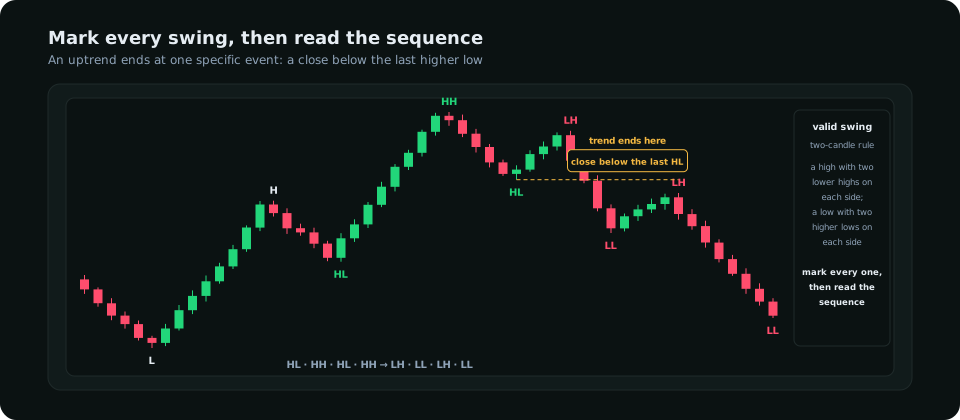
A swing high is a candle whose high is higher than the highs of the candles on either side of it, with at least two lower highs each side for a swing that matters on its timeframe. A swing low is the mirror. The two-candle rule filters out the noise of single-bar wicks; a three-candle rule is stricter and gives fewer, more significant swings. Pick one rule and apply it mechanically. The common failure is marking swings by eye, which means marking the ones that support the view already held. Mark every swing that passes the rule, then read the sequence.
The three states
| State | Sequence | What to do | Ends when |
|---|---|---|---|
| Uptrend | HH · HL · HH · HL | Buy pullbacks toward the last HL; no shorts | A close below the last HL |
| Downtrend | LH · LL · LH · LL | Sell rallies toward the last LH; no longs | A close above the last LH |
| Range | Highs and lows roughly level; no sequence | Fade the edges, or wait for a break with displacement | A close beyond the range extreme that holds |
The "what to do" column is the entire value of the read. A trend read tells you which direction you are allowed to trade and which setups to ignore. In an uptrend, every hourly short signal is the pullback the daily chart already expects; in a range, every breakout signal at the edge is a sweep until a close proves otherwise. The technical analysis guide places this read first among four; the other three depend on it.
The one event that ends a trend
An uptrend does not end because price falls, because a moving average turns, or because an indicator diverges. It ends when price closes below the last higher low on the timeframe being read. That is a break of structure against the trend, and until it prints, the trend is intact and every decline is a pullback. The break of structure guide covers the mechanics; the change of character article explains why the first break against a trend is read differently from a break with it. Two refinements. The break must be a close, not a wick: a wick below the higher low that closes back above is a sweep of the stops under it and often the start of the next leg up. And a trend that has broken is not yet a trend the other way: it takes a lower high and then a lower low to establish the downtrend, and the time between is a range.
Pullback or reversal
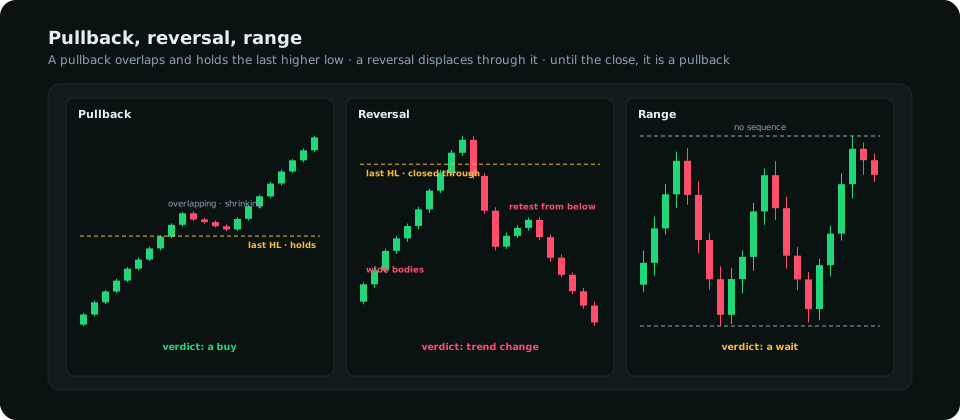
The pullback problem is the one that costs trend traders the most: every pullback looks like the start of a reversal while it is happening. Three tells separate them before the structural event. Character of the move: a pullback is corrective, with overlapping candles and shrinking bodies; a reversal is impulsive, with wide bodies closing near their extremes. Depth: a pullback typically retraces into the 38–62% region of the last impulse and holds; a move that cuts through 78% is usually going all the way. Volume and speed: a pullback drifts; a reversal travels. None of these replaces the close below the higher low, which is the only proof; they adjust how much to trust the trend read in the meantime, and whether the pullback is worth buying.
Keeping it consistent across timeframes
Each timeframe has its own swings and its own trend, and they disagree constantly: the daily is up, the four-hour is in a pullback (which reads as down), the hourly is bouncing. The rule is hierarchical. The daily trend decides the direction of trades. The four-hour trend describes where in the daily trend's cycle price is: a four-hour downtrend inside a daily uptrend is the pullback, and its end (a four-hour close above its last lower high) is the signal the pullback is over. The hourly supplies the entry on that signal. Reading the hourly trend as if it decided direction is how traders end up short at the bottom of every daily pullback. The dealing range article adds the location read that goes with the trend: buy pullbacks in the discount half, sell rallies in the premium half.
A worked GBP/USD read
Daily: swings over the past six weeks read HL 1.2610, HH 1.2790, HL 1.2680, HH 1.2850, and price is now 1.2720 after four days of overlapping red candles. State: uptrend, in a pullback. The trend ends only on a daily close below 1.2680. Four-hour: LH, LL, LH, LL since the 1.2850 high, so the four-hour is in a downtrend, which is the daily pullback in progress; the last four-hour lower high is 1.2765. Hourly: a sweep of 1.2700 and a close back above. Read: the daily allows longs only; the four-hour pullback is still in force until 1.2765 is closed above; the hourly has given an early signal. Options: a small long now with the stop below 1.2680 and the first target at 1.2765, or the full-size long when the four-hour closes above 1.2765. Shorting the four-hour downtrend is not an option the daily allows. Moving averages would show the same picture a day or two later, which is the cost of using an approximation.
Frequently asked
What is the best indicator to identify a forex trend?
None is needed. Mark swing highs and lows by a fixed rule and read the sequence; higher highs and higher lows is an uptrend, lower highs and lower lows a downtrend. Indicators approximate this with a lag.
How do I know when a trend has ended?
When price closes beyond the last swing that defined it: below the last higher low in an uptrend, above the last lower high in a downtrend. A wick through that level is a sweep, not an end.
Which timeframe should I use for trend analysis?
The daily chart decides direction; the four-hour shows where in the cycle price is; the hourly times the entry. Reading a lower timeframe's trend as the direction is the most common error.
Everything on SMC Terminal is analysis and education, not a recommendation to buy or sell. Figures in the example are illustrative. Trading carries a substantial risk of loss. Manage your risk.