RSI Indicator Explained: Overbought, Oversold and Divergence
The RSI indicator is on more charts than any other oscillator and misread on most of them. This guide explains what the number actually measures, why 70 and 30 are the wrong lines in a trend, how to read regular and hidden divergence properly, and the three ways to use RSI that hold up — with the two that quietly lose money.
The Relative Strength Index was published by J. Welles Wilder in 1978 for commodity futures, and it has been the default momentum oscillator on every charting platform since. That ubiquity is the problem. Most traders learn two rules — above 70 is overbought, below 30 is oversold — and then wonder why selling at 72 in a bull market keeps losing. The indicator is better than that. It just needs to be read as what it is: a measure of the balance of recent up-closes against down-closes, not a buy or sell signal.
What RSI actually measures
Over the lookback (14 periods by default), RSI compares the average size of the up-closes to the average size of the down-closes. The ratio of the two is the relative strength; the index simply maps it onto a 0–100 scale.
| Step | What is done |
|---|---|
| 1 | For each of the last 14 bars, record the gain (close − previous close) if positive, else 0; and the loss if negative, else 0. |
| 2 | Average the gains and average the losses (Wilder uses a smoothed average, so older bars decay rather than drop out). |
| 3 | RS = average gain ÷ average loss. |
| 4 | RSI = 100 − 100 ÷ (1 + RS). |
Two things follow from the arithmetic. First, RSI at 50 means up-closes and down-closes have been equal in size over the window — 50 is the real midline, and which side of it RSI lives on is the most reliable thing the indicator tells you. Second, a reading of 75 does not mean "too high"; it means the last two weeks have been dominated by up-closes. In a strong trend that is simply true, and it stays true for a long time.
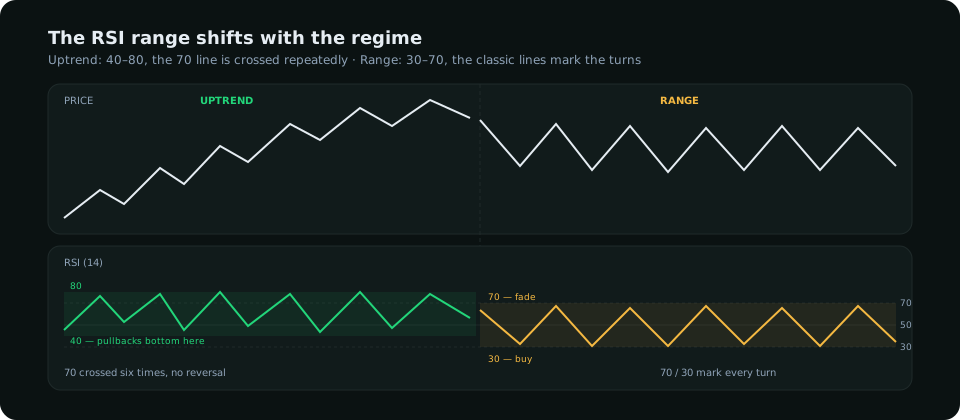
Why 70 and 30 are the wrong lines in a trend
Wilder's levels were drawn for markets that oscillate. In a trending market the whole RSI range shifts. Constance Brown's observation, still the most useful refinement of the indicator, is that in an uptrend RSI tends to hold a 40–80 range: the rallies push to 80, the pullbacks bottom near 40 and rarely reach 30. In a downtrend it holds 20–60: the drops reach 20, the bounces fail near 60.
| Regime | RSI range | What a "support" reading looks like | What signals a regime change |
|---|---|---|---|
| Uptrend | 40 – 80 | Pullback bottoms at 40–50, turns up | RSI breaks below 40 and fails to reclaim 60 on the bounce |
| Downtrend | 20 – 60 | Bounce tops at 50–60, turns down | RSI breaks above 60 and holds above 40 on the dip |
| Range | 30 – 70 | The classic lines work: fade 70, buy 30 | RSI pins at 70+ or 30− for several bars — a trend starting |
So the first practical use of RSI has nothing to do with overbought or oversold. It is regime reading: look at where RSI has been bottoming and topping for the last few swings. If the lows are at 40–45, you are in an uptrend and the next touch of that area is a pullback entry, not a warning. If the lows have started reaching 30, the trend is losing its range.
Divergence, done properly
Divergence is the second thing RSI is good at, and the one most often misapplied. It comes in two kinds, and they mean opposite things.
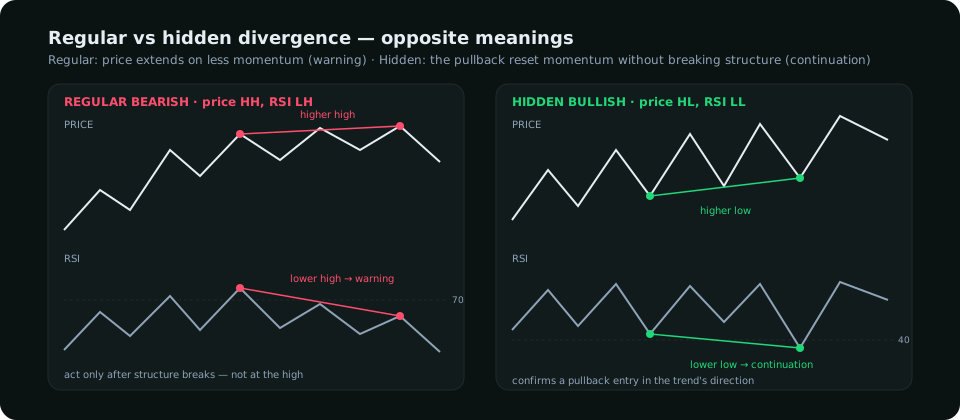
- Regular divergence — price makes a higher high, RSI makes a lower high (bearish); or price makes a lower low, RSI makes a higher low (bullish). The move is extending on less momentum than the previous leg. It is a warning that the trend is tiring, not a trigger.
- Hidden divergence — price makes a higher low, RSI makes a lower low (bullish); or price makes a lower high, RSI makes a higher high (bearish). The pullback has reset momentum without breaking structure. It is a continuation signal in the trend's direction and, in practice, a more reliable one than regular divergence.
Three rules keep divergence honest. The two swing points must be clearly separate swings, not two bars in the same push. The divergence is only meaningful at a level that matters — a prior high, a supply zone, a liquidity pool — because divergence into nothing is just a slower leg. And regular divergence in a strong trend can persist through three or four higher highs; it tells you to tighten management or wait for a structure break, never to short the high.
Three uses that hold up
- Trend-range pullback entries. Identify the trend from structure on the chart (higher highs and higher lows, or the reverse — the market-structure method covers this). Then use RSI's trend range as the pullback gauge: in an uptrend, RSI returning to 40–50 at a prior swing low or demand zone is the entry area. The stop goes below the structure, not below an RSI number.
- Hidden divergence as confirmation. When the pullback also prints hidden divergence, the probability that it is a pullback rather than a reversal rises. It is a filter on an entry you already had, not a reason to enter.
- Regular divergence as a reason to stop adding. Two consecutive regular divergences at a higher-timeframe level are a strong argument to take profit on a trend trade and to stop looking for new entries in that direction. They are a weak argument to go the other way until structure breaks.
Two uses that quietly lose money
- Selling 70, buying 30, without a regime check. In a trend this sells every pullback-free rally and buys every leg of a crash. The classic lines earn only in ranges — and only at range edges where there is a reason for price to turn.
- Using RSI on the entry timeframe alone. A 5-minute RSI at 25 inside a daily downtrend is not oversold; it is a downtrend. Read the regime on the higher timeframe first, then use the lower-timeframe RSI for timing in that direction only.
Settings and timeframes
The 14-period default is fine on every timeframe and there is little evidence that changing it helps. Shorter settings (7 to 9) produce more signals and more noise; longer settings (21) smooth the line but delay the divergence you were using it for. Rather than tune the period, tune the levels to the regime as described above. On the question of timeframe: use the same one you read structure on, and treat RSI on a lower timeframe strictly as timing.
RSI pairs best with information it does not contain. It knows nothing about who is positioned, what the dollar is doing, or whether a session is about to open. A bullish hidden divergence into demand with speculators net long and the dollar weakening is a different trade from the same picture with every independent read against it. The indicator measures the balance of closes. Everything else has to come from somewhere else.
Quick reference
| Reading | In a range | In a trend |
|---|---|---|
| RSI above 70 | Look to fade at resistance | Normal — trend is strong; do not short it |
| RSI below 30 | Look to buy at support | Normal in a downtrend — do not buy it |
| RSI at 40–50 in an uptrend | — | Pullback zone; look for the entry at structure |
| Regular divergence | Reversal setup at the range edge | Warning only; wait for a structure break |
| Hidden divergence | Weak | Continuation confirmation on a pullback |
| RSI crossing 50 | Noise | Confirms the side the trend is on |
Everything on SMC Terminal is analysis and education, not a recommendation to buy or sell. Trading carries a substantial risk of loss. Manage your risk.