How to Identify Support and Resistance Zones on Forex Charts
Support and resistance in forex are zones, not lines, and most of the ones traders draw are not worth drawing. This guide gives the rules that separate a zone that will react from a level that merely looks tidy: how it was formed, how often it has been tested, what it coincides with, and whether the liquidity behind it has already been taken. It covers role reversal, the sweep that fakes a break, and how to turn a zone into a stop and a target.
Support and resistance are the oldest ideas in chart reading and the most carelessly applied. A chart with fifteen horizontal lines on it is a chart on which something is always "at a level", which means the levels decide nothing. The useful version is narrower: a handful of zones, each with a reason to exist, each with a known number of tests, each either intact or already consumed. This guide sets out how to find those zones on a forex chart, how to tell when one has stopped working, and how the sweep of a level differs from a break of it, which is the distinction that costs traders the most.
Zones, not lines
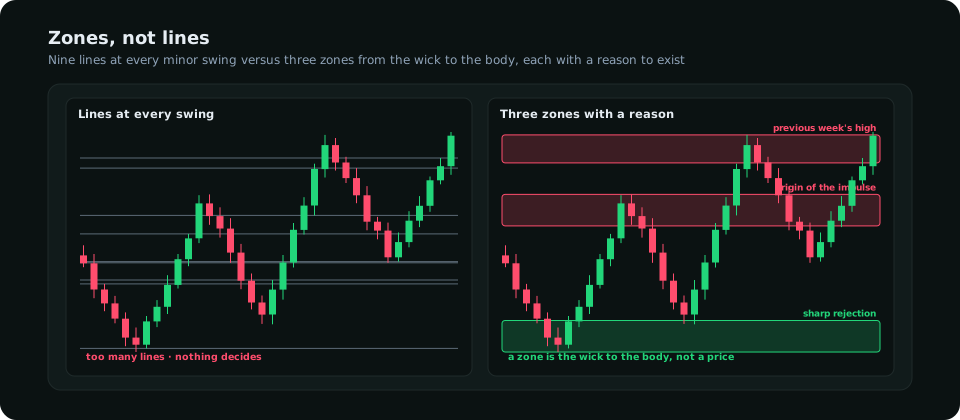
A level in forex is a region, because the orders that create it are spread across a band of prices and because the spread, the broker's feed and the time of day all shift where a candle's extreme prints. Draw a zone from the wick extreme to the nearest candle body of the rejection that formed it; on a daily chart that is typically 15–40 pips on a major, on a four-hour chart 8–20. Price reaching the body edge counts as a test; price poking through the wick edge without closing beyond it is a sweep, not a break. Treating the zone as a single price is how traders are stopped out by a few pips on a move that then goes their way.
Four tests of a zone worth drawing
| Test | Strong zone | Weak zone |
|---|---|---|
| How it formed | Sharp rejection: a long wick, or an impulsive move away within one or two candles | A slow, overlapping turn; price drifted away |
| How many tests | Untested, or tested once | Tested three or more times; each test consumes the orders behind it |
| Confluence | Coincides with a round number, a previous day/week high or low, a fib level or the origin of a higher-timeframe impulse | Stands alone on one timeframe |
| Liquidity | The stops beyond it have not been run; equal highs or lows sit just beyond it | Already swept; the obvious stops are gone |
The second row contradicts a common teaching. "The more times a level is tested, the stronger it is" describes a level that has repeatedly held, but every hold spends the orders that produced it; the fourth test of a support zone is the one most likely to fail, and a four-times-tested level is a target for the break, not a place to buy. The liquidity sweep guide explains the fourth row: a zone whose stops have already been run has lost the fuel that made it react.
Where the best zones come from
- The origin of an impulse. The last candle before a strong move is where the orders that drove it were filled; the zone around it is the same thing order block traders mark, and it is the highest-quality support or resistance on any chart.
- Previous session extremes. The previous day's and week's high and low are watched by everyone with a chart, which makes them react and makes them sweep targets.
- Round numbers. 1.1000, 150.00, 2,000 on gold: options are struck there, orders cluster there.
- Higher-timeframe swings. A weekly swing low is a zone on every lower timeframe; an hourly swing low is a zone on none above it. Draw from the top down.
Role reversal and the sweep
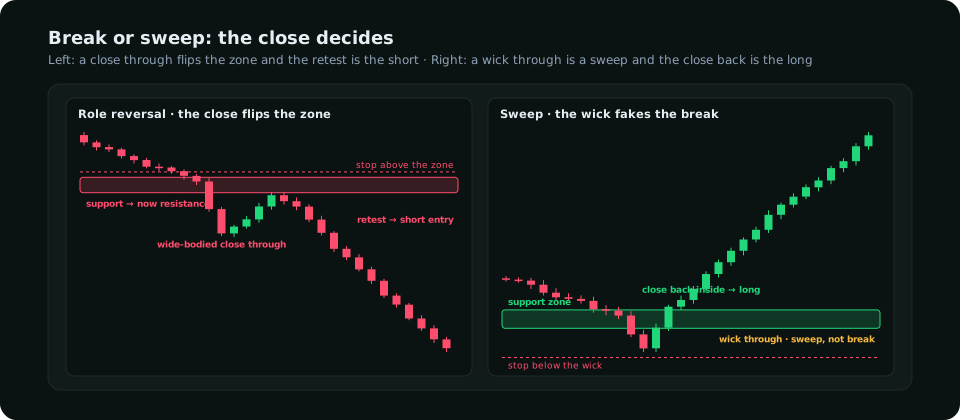
When price closes through a zone with a wide-bodied candle, the zone changes sides: broken support becomes resistance, and the first retest from the other side is one of the cleanest entries in forex, with the stop just beyond the zone. When price only wicks through and closes back inside, nothing has broken; the stops beyond the zone were taken and the move usually goes the other way. The distinguishing fact is the close on the timeframe that drew the zone: a daily zone is broken by a daily close, not by an hourly wick. Traders who sell the "break" of a daily support on an hourly candle are, more often than not, selling the sweep that precedes the rally.
How many to keep
Three zones above price and three below, from the daily and four-hour charts, is enough for any pair. Review them weekly: delete a zone once it has been closed through and its first retest is over, since from then on it is ordinary price; delete one that has been tested three times; add the origin of each new impulse as it forms. The result is a chart that changes slowly, where a reaction at a zone means something because there are few of them. The dealing range article adds the one more reading that decides which of the zones to trade from: only demand zones in the discount half for longs, only supply zones in the premium half for shorts.
From zone to trade
A zone is the location, not the trigger. The sequence: price enters the zone; a rejection prints on the timeframe below (a wick and a close back in the zone's direction); the lower timeframe breaks its last swing in that direction. Entry on that break or its retest. Stop beyond the far edge of the zone plus a buffer of about a quarter of the zone's height, so that a sweep of the edge does not take it. First target the nearest opposing zone; second target the next one. If the distance to the first target is less than 1.5 times the stop, the zone is too close to the next one to trade, and that is a frequent and correct outcome. The break of structure guide covers the lower-timeframe confirmation; the stop placement guide covers sizing the buffer by volatility.
Frequently asked
How wide should a support or resistance zone be?
From the wick extreme to the nearest candle body of the rejection that formed it. On daily majors that is usually 15–40 pips; on gold's daily chart 10–25 dollars. Wider than that and the zone is two zones.
Is a level stronger the more it is tested?
No. Each test consumes orders. One or two tests is strong; three or more is a level waiting to break, and the break is the better trade.
How do I know if support has broken or been swept?
By the close on the timeframe that drew the zone. A close beyond it with a wide body is a break; a wick beyond it with a close back inside is a sweep, and the move usually reverses.
Everything on SMC Terminal is analysis and education, not a recommendation to buy or sell. Figures in the example are illustrative. Trading carries a substantial risk of loss. Manage your risk.