NAS100 Trading: How to Trade the Nasdaq 100 Index by Session, Driver and Structure
NAS100 trading is index trading with the volume turned up: the Nasdaq 100 moves two to three times as far as the S&P 500 in a day, it is driven by a handful of mega-cap stocks and by US yields, and most of its daily range is made in the first ninety minutes of the US cash session. This guide covers what the index is, what moves it, the session map, the drivers to check before the open, a structure-based plan for the cash open, and the sizing that keeps a 200-point day survivable.
NAS100 trading means trading a CFD or future on the Nasdaq 100, the index of the hundred largest non-financial companies listed on the Nasdaq exchange. It is the retail trader's favourite index for a reason that cuts both ways: it moves. A normal day's range is 1–1.5% of the index level, two to three times the S&P 500's, which makes it rewarding on the right side and unforgiving on the wrong one. This guide covers what the index actually is, what drives it, when it moves, a plan for the US cash open built on structure rather than indicators, and the sizing arithmetic that keeps a 200-point day from ending an account.
What NAS100 is
The CFD tracks the E-mini Nasdaq 100 future (NQ), which tracks the cash index. It is capitalisation-weighted, so the ten largest companies, the mega-cap technology names, carry roughly half the index's weight; on many days NAS100 is a trade on five stocks and the bond market. It trades nearly 24 hours on the futures market, but the cash session, 13:30–20:00 UTC (14:30–21:00 Pakistan time in winter; an hour earlier in summer), is when the volume and the range arrive. CFD prices carry a spread of one to three points and overnight financing; the platform guide covers what to compare.
What moves it
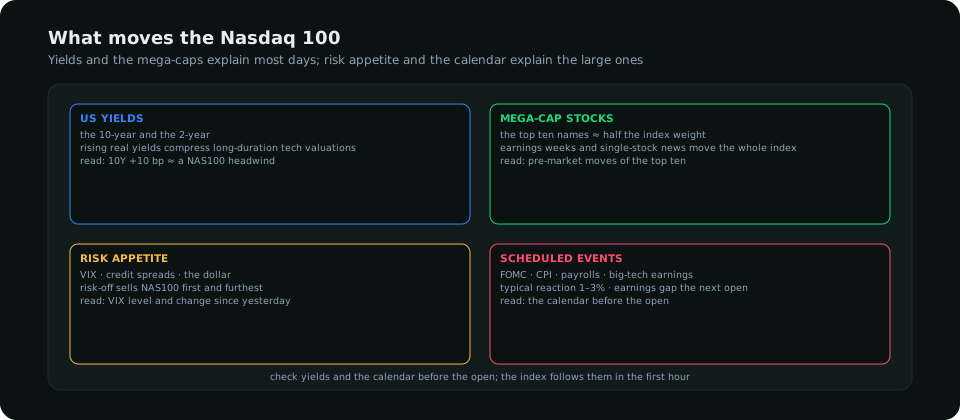
| Driver | Effect | Check before the open |
|---|---|---|
| US yields | Rising real yields compress the valuations of long-duration growth stocks; NAS100 falls when the 10-year rises sharply and rallies when it falls | The 10-year and 2-year change since yesterday's close; the yields guide |
| Mega-cap stocks | Half the index is ten companies; their earnings and guidance move the whole thing | Pre-market moves of the top ten; the earnings calendar |
| Risk appetite | In risk-off episodes NAS100 falls first and furthest among the indices | VIX level and change; the dollar and credit |
| Scheduled events | FOMC, CPI and payrolls produce 1–3% moves; big-tech earnings after the close gap the next open | The calendar and the earnings dates |
The session map
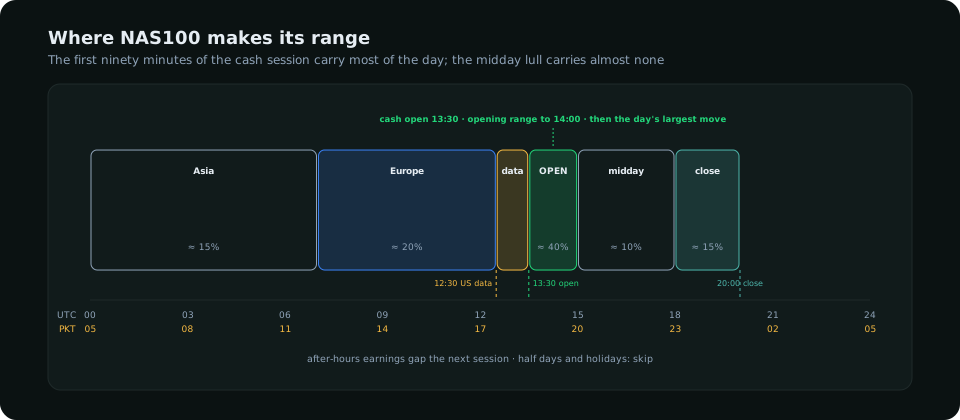
The pattern most days: the overnight future drifts with Asian and European equities and sets a pre-market level; the 12:30 UTC US data moves it; the cash open at 13:30 produces fifteen to thirty minutes of two-way range (the opening range) as the open orders are worked; the break of that range in one direction is the day's largest move, usually complete by 15:00; midday is a lull; the last two hours position into the close. The New York session guide covers the same window for the dollar pairs; for NAS100 the cash open is the whole event.
A plan for the cash open
- Before 13:30: daily trend by swings; the previous day's high, low and close; the overnight high and low; yields since yesterday; the calendar for the day; the pre-market moves of the mega-caps. Bias from the daily structure and the yields read.
- 13:30–14:00: let the opening range form. Mark its high and low. No trades in the first fifteen minutes; the spread is wide and the orders are being worked.
- The setup: a sweep of the opening range high or low, or of the overnight extreme, followed by a five-minute close back inside with displacement. With the bias, it is the trade; against the bias, it is a smaller trade back to the range midpoint. The liquidity grab guide covers the read.
- Stop: beyond the sweep's extreme plus 0.1 times the daily ATR (about 20 points on a 200-point ATR day). Target: the opposite side of the opening range first, the previous day's high or low second.
- Time stop: a position still open at 15:30 UTC with no progress is closed; the midday lull rarely finishes a move.
- Two trades a day. If both lose, the read was wrong; the fix is tomorrow's analysis.
Sizing in points
NAS100 is quoted in index points and a CFD is typically one dollar per point per contract (brokers vary; check). A 200-point daily ATR means a sensible stop is 20–40 points. On a 10,000-dollar account at 0.5% risk, 50 dollars of risk over a 25-point stop is two dollars per point, or two contracts at one dollar a point. The mistake that ends index traders is sizing by the number of contracts they are used to on a quieter index: five contracts on NAS100 with a 40-point stop is 200 dollars at risk, 2% of a 10,000-dollar account, on a single intraday trade. Size from the stop in points and the risk in dollars every time, as the position size guide describes; the ATR changes by half from a quiet week to an FOMC week and the contract count has to change with it.
The days to treat differently
- FOMC day: the cash open is often quiet and the day's move comes at 18:00 UTC with the statement and 18:30 with the press conference; the opening-range plan does not apply, and the FOMC guide covers the alternative.
- CPI and payrolls days: the 12:30 release sets the direction before the open; the opening range often resolves as a continuation of the release move, and the sweep setup is more reliable than usual.
- Mega-cap earnings weeks: after-hours reports gap the next open by 1–2%; the first hour is dominated by one stock. Reduce size or wait for the second hour.
- Half days and holidays: thin, trending slowly, with no afternoon; skip them.
What indices add to a forex trader's view
NAS100 is the clearest expression of risk appetite in the markets a retail platform offers, and it reads across to currencies: a falling NAS100 supports the yen and the Swiss franc and weighs on the Australian dollar and the other risk currencies, as the terminal's intermarket read scores. Watching the index even without trading it tells a forex trader which regime the day is in. The analysis tools guide places that read among the others.
Frequently asked
What is the best time to trade NAS100?
The first ninety minutes of the US cash session, 13:30–15:00 UTC (14:30–16:00 Pakistan time in winter), after the opening range has formed. That window produces most of the day's range; the midday lull produces almost none.
How many points does NAS100 move in a day?
Typically 1–1.5% of the index level, which at an index around 20,000 is 200–300 points. The 14-day ATR on your chart is the number to size from, and it changes with the week's events.
Is NAS100 good for beginners?
It is less forgiving than EUR/USD: wider spreads, larger and faster moves, and gaps around earnings. A beginner is better served by learning the opening-range method on a quieter index or a major pair first, then applying it here at small size.
Everything on SMC Terminal is analysis and education, not a recommendation to buy or sell. Figures in the example are illustrative. Trading carries a substantial risk of loss. Manage your risk.