Forex Analysis Tools: Comparing Charts, Macro Data and Positioning
Forex analysis tools come in three kinds that answer three different questions: charts show where price is, macro data shows why a currency should move, and positioning shows who already owns the move. This guide compares the three on what they can and cannot tell you, the free and paid sources for each, how much work each takes to keep current, and how to combine them without letting one lens override the others.
Forex analysis tools are usually compared as products, platform against platform, which misses the point: the real choice is between three kinds of evidence, and most traders use one of them almost exclusively. A chart shows what price has done and where it is sitting; it does not say why. Macro data (yields, inflation, the calendar) says why a currency should strengthen; it does not say when. Positioning data (the COT report, retail sentiment) says who already owns the move and how crowded it is; it does not say where to enter. A trader with all three lenses asks a better question than one with a dozen chart indicators. This guide compares the lenses, the tools that serve each, and how to keep them in proportion.
Three lenses, three questions
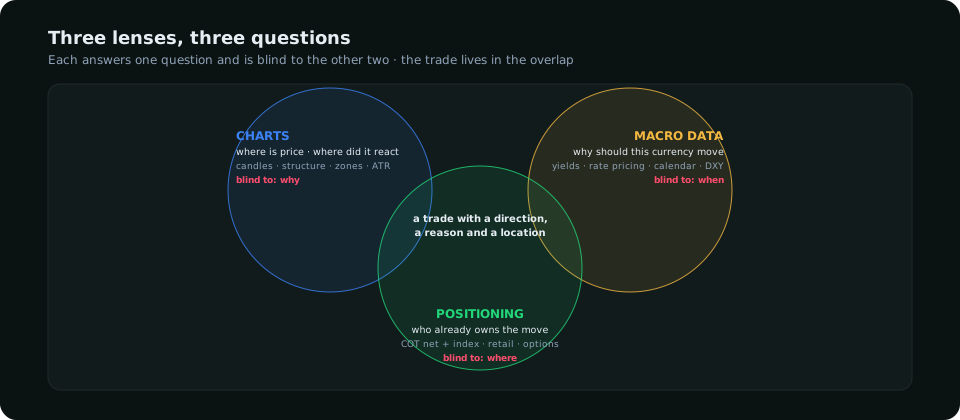
| Lens | Answers | Blind to | Changes | Core tools |
|---|---|---|---|---|
| Charts | Where price is, where it reacted, the trend and the range | Why; whether a level will hold this time | Every candle | A charting platform; structure, zones, ATR |
| Macro data | Why a currency should gain or lose over weeks | When; how much is already priced | With each release; weekly in effect | Yield curves, rate-path pricing, the calendar, inflation and jobs data |
| Positioning | Who owns the move; how crowded it is | Where to enter; this morning's flow | Weekly (COT); hourly (retail) | CFTC COT, retail sentiment feeds, options open interest |
Charting tools
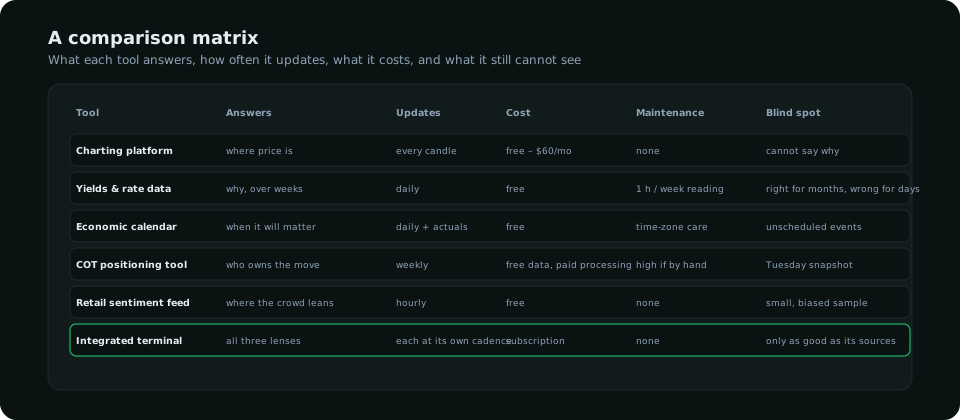
Every platform draws the same candles; the differences are in what else they make easy. For analysis rather than execution, the tests are: multi-timeframe layouts (daily, four-hour, hourly side by side), clean drawing tools for zones and ranges, a volatility measure (ATR) and session shading in your own time zone. Indicators beyond that are optional, and the indicator overview argues most are redundant with the structure read. TradingView remains the default for analysis and MetaTrader 4 and 5 for execution; the TradingView workflow guide and the MT5 setup guide cover the layouts. Cost: free to around 60 dollars a month. Maintenance: none, the data arrives by itself. Blind spot: the chart cannot tell you that the level you are buying is the one the funds have been selling into for three weeks.
Macro data tools
The macro lens needs four feeds. Yields: the 2-year and 10-year for each currency, and for gold the 10-year real yield, from the US Treasury, FRED or the national debt offices, all free. Rate-path pricing: what the market expects the central bank to do, from futures-implied probabilities (the CME FedWatch tool for the US; OIS curves elsewhere), free or bundled with a terminal. The calendar: release times, forecasts and actuals, free from several providers, with the time-zone caveat in the calendar guide. The dollar index, because almost every pair is a dollar pair. Cost: free, with paid terminals adding convenience rather than data. Maintenance: the work is in reading, not collecting; a weekly hour to update the rate view per currency is enough. Blind spot: macro is often right for months before it is right for a day, and a trader who shorts a currency because its data is weak will be stopped out repeatedly before the trend arrives. The fundamental analysis guide covers the reading.
Positioning tools
The COT report is the core: free from the CFTC every Friday, but raw, as text or CSV with the groups and columns to be parsed, netted and rescaled over a three-year window before it says anything. Tools that do that work (nets, weekly change, the COT index per market) are the difference between having the data and using it; the COT forex guide explains the read once the numbers are in shape. Retail sentiment from broker feeds is hourly and contrarian in direction but is a small, biased sample; useful as a footnote. Options positioning (large strikes, expiries) is available for the majors and gold from the exchanges and matters for intraday magnetism. Cost: free data, paid processing. Maintenance: weekly, and the processing has to be exact, which is the strongest argument for a tool over a spreadsheet. Blind spot: positioning is a Tuesday snapshot released Friday; it says nothing about the move that started Thursday.
A comparison matrix
Keeping the lenses in proportion
The failure modes are predictable. Chart-only traders fight the fundamentals on the days that matter and never know why their best setups failed. Macro-only traders are right and broke, because being right about direction is worth nothing without location and timing. Positioning-only traders fade every crowded market and get run over by the last leg of every trend. The workflow that keeps them in proportion runs in a fixed order: macro sets the direction allowed (weekly), positioning adjusts conviction and warns of crowding (Friday), the chart supplies the location and the trigger (daily and intraday). Each lens is consulted for its own question and not asked the others. The dashboard guide lays out the eight panels that put all three on one screen, and the software comparison covers what to look for when buying rather than assembling.
Assemble or subscribe
A trader can assemble the chart and macro lenses for free in a weekend and keep them current in an hour a week. The positioning lens is the one that resists assembly: parsing the COT every Friday across the markets you trade, netting the groups, maintaining a three-year window per market and rescaling it correctly is a recurring job that spreadsheets do badly and that most traders abandon after a month. That is the gap an integrated terminal fills: SMC Terminal was built around it, with the COT nets and index for 17 markets, the yields and macro reads, the calendar and session clock in your zone, and the pair's composed bias on one screen, so the three lenses are consulted in the order above without a Friday afternoon of data entry.
Frequently asked
What is the best forex analysis tool?
There is no single one, because the three lenses answer different questions. A charting platform, a free macro feed and a processed COT source together are the minimum; an integrated terminal saves the assembly.
Are free forex analysis tools enough?
For charts and macro data, yes. For positioning, the data is free but the processing is the work, and that is where most traders either pay or give up.
Which matters more, technical or fundamental analysis?
Neither; they answer different questions. Fundamental and positioning analysis decide direction and conviction; technical analysis decides location and timing. A trade needs all three.
Everything on SMC Terminal is analysis and education, not a recommendation to buy or sell. Figures in the example are illustrative. Trading carries a substantial risk of loss. Manage your risk.