How to Trade Forex Step by Step: From Market Analysis to Trade Review
How to trade forex is less a question of secrets than of sequence. This guide lays out the seven steps a trade goes through — bias, level, trigger, stop, size, management, review — with what each one needs, where beginners skip, and a one-page record that turns every trade into data.
Learning how to trade forex is mostly learning a sequence. Every trade that is worth taking passes through the same seven steps, in the same order: a directional bias, a level where that bias can be expressed, a trigger that says the level is holding, a stop where the idea is wrong, a size derived from that stop, a management plan for what happens next, and a review that turns the result into a record. Skip a step and the trade is a guess with a lot size attached. This guide walks the sequence once in full, with a worked example, and ends with the one-page record that makes the seventh step automatic.
The seven steps at a glance
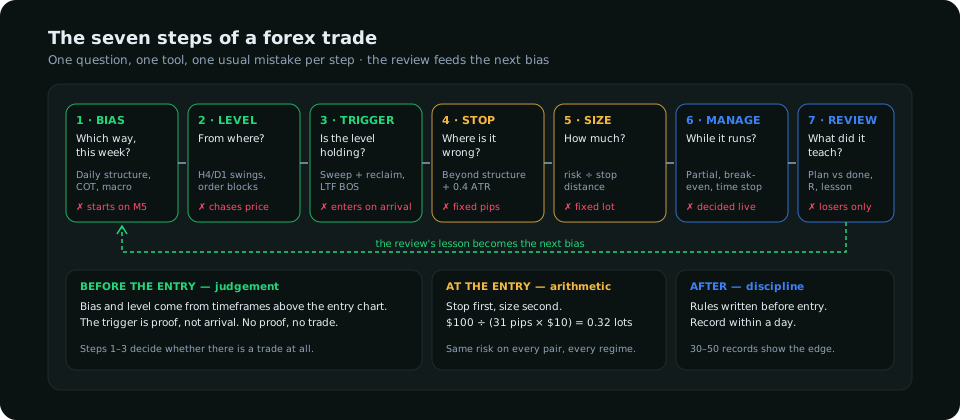
| Step | Question it answers | Where the answer comes from | The usual mistake |
|---|---|---|---|
| 1. Bias | Which way, this week? | Higher-timeframe structure, positioning, the macro backdrop | Starting from the 5-minute chart |
| 2. Level | From where? | Swing points, order blocks, prior range edges on the 4-hour and daily | Chasing the current price |
| 3. Trigger | Is the level holding? | A sweep and reclaim, a lower-timeframe structure shift | Entering on arrival, before any proof |
| 4. Stop | Where is the idea wrong? | Beyond the structure that defines the trade, plus a volatility buffer | A fixed pip distance |
| 5. Size | How much? | Account risk ÷ stop distance | A fixed lot |
| 6. Management | What happens while it runs? | Rules written before entry: partial target, break-even, time stop | Deciding live, under stress |
| 7. Review | What did this trade teach? | The record: plan versus execution, outcome, lesson | Reviewing only losers |
Step 1 — Bias: decide the direction before the chart
A bias is a view on direction for the next few sessions, built from evidence that does not come from the entry timeframe. Three sources carry most of the weight. First, higher-timeframe structure: on the daily chart, is price making higher highs and higher lows, lower highs and lower lows, or neither? Second, positioning: the weekly CFTC report says whether large speculators are already crowded one way, which matters because crowded trades reverse harder — the COT guide covers how to read it. Third, the macro backdrop: rate expectations and risk appetite, which move currency pairs over weeks, not hours.
The bias is written down as one sentence with a condition: "EUR/USD bullish while the daily holds 1.0850; speculators are only moderately long, so there is room." A bias without a condition cannot be wrong, which means it cannot be useful.
Step 2 — Level: where the bias can be expressed cheaply
A level is a price area where, if the bias is right, the market should turn — and where, if it is wrong, you find out quickly. The best levels sit on the 4-hour or daily chart: the last swing low in an uptrend, the origin of the move that broke structure (the order block), the edge of a prior range. Price being far from any level is itself an answer: wait. The premium and discount rule adds a second filter — in a bullish bias, levels in the lower half of the current range are worth more than levels in the upper half.
Step 3 — Trigger: proof that the level is holding
Arriving at a level is not a trade. The trigger is the lower-timeframe evidence that buyers (in a bullish bias) actually showed up there. Two triggers cover most cases: a liquidity sweep of the level followed by a close back inside it, or a break of structure on the 15-minute or 1-hour chart in the direction of the bias. Both say the same thing — the last sellers were absorbed — and both give a precise invalidation, which step 4 needs.
Step 4 — Stop: the price where the idea is wrong
The stop goes where the trade's logic fails, not where the loss feels tolerable. For a long from a swept low, that is below the sweep's wick plus a buffer of roughly a third to a half of the timeframe's ATR, so ordinary noise does not take it. The stop-loss guide goes through the three placements and when each applies. A stop placed first, before size, is what makes the next step mechanical.
Step 5 — Size: derived from the stop, never chosen
Size is the one step that is pure arithmetic. Decide the risk per trade in money (0.5–1% of the account is the common range), measure the stop distance in pips, and the lot size follows from the pip value. The lot size calculator article shows the formula and the pip values for the major pairs. A trader who sizes from the stop has the same risk on a 25-pip EUR/USD trade and a 90-pip GBP/JPY trade; a trader who uses a fixed lot has four times the risk on the second without noticing.
Step 6 — Management: rules written before entry
Management is everything between entry and exit, and it has to be decided while you are calm. Three rules cover most plans:
- First target — a partial exit at the nearest opposing level or one daily ATR, which pays for the trade and lowers the pressure on the rest.
- Break-even rule — the stop moves to entry only after a defined event (a new structure point in your favour), not after a fixed number of pips, which just invites a stop-out on noise.
- Time stop — if the trade has not moved toward target within a set number of candles or by the end of the session that was supposed to drive it, exit flat. A trade that does nothing is information.
The risk-to-reward article explains why the first target has to be at least as far away as the stop for the plan to survive a normal win rate.
Step 7 — Review: the step that compounds
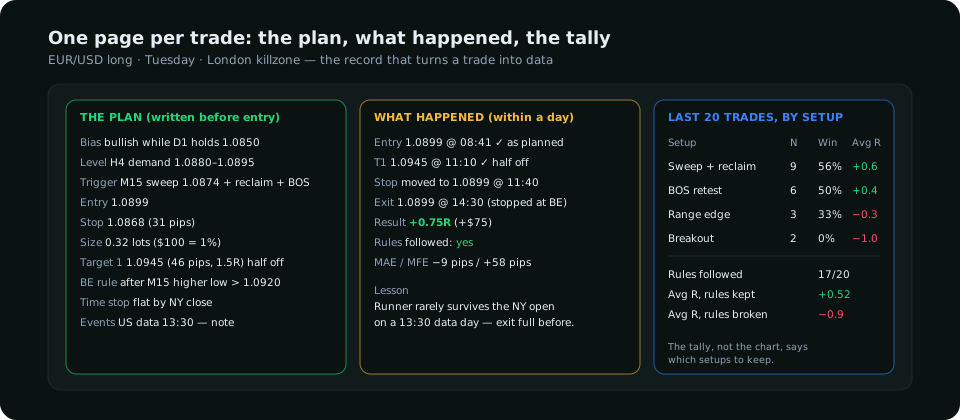
A review is a comparison of the plan against what actually happened, written within a day of the exit. It is not a search for what went wrong; winning trades that broke the rules are the more dangerous lesson. The record needs only a handful of fields, shown below, and over 30–50 trades it answers the questions that no amount of chart study can: which setups earn, which sessions earn, and whether the management rules add or subtract.
A worked example, start to finish
| Step | EUR/USD, a Tuesday in London |
|---|---|
| Bias | Daily uptrend, higher lows intact above 1.0850; speculators moderately long (not extreme); the euro's rate differential stable. Bullish while 1.0850 holds. |
| Level | 4-hour demand at 1.0880–1.0895, the origin of last week's break of structure, in the lower half of the current range. |
| Trigger | 08:40 London: price sweeps 1.0878, closes the 15-minute candle back above 1.0885, then breaks the 15-minute lower high at 1.0898. |
| Stop | Below the sweep wick at 1.0874, minus a buffer: 1.0868. Distance from a 1.0899 entry: 31 pips. |
| Size | $10,000 account, 1% risk = $100; $100 ÷ (31 pips × $10 per pip per standard lot) = 0.32 lots. |
| Management | Half off at 1.0945 (the 4-hour swing high, 46 pips, 1.5R); stop to entry only after a 15-minute higher low forms above 1.0920; flat by the New York close if no progress. |
| Review | First target hit at 11:10; remainder stopped at entry 14:30 after a reversal. Net +0.75R. Rules followed: yes. Lesson: the second half rarely survives the New York open on a day with US data at 13:30 — consider a full exit before red events. |
Where the sequence usually breaks
Three failures account for most of the damage in a new trader's first year. Starting at step 3: a pattern on the 5-minute chart feels like a trigger, but without a bias and a level it is a coin flip with a stop. Skipping step 5: a fixed lot size turns the same method into a different risk on every pair. Abandoning step 7 after the first bad week: the record is the only thing that tells you whether the bad week was variance or a broken rule.
The routine the terminal walks
SMC Terminal's Home tab is this sequence as a daily routine: the bias from positioning, seasonality and the macro regime; the levels and triggers from market structure on the Market Trend tab; the stop and targets drawn on the day plan; sizing left to the trader. The daily workflow article describes how the steps fit into a session, and the beginner's guide covers the vocabulary — pips, lots, spreads — the arithmetic above assumes.
Frequently asked
How long does it take to learn to trade forex?
Learning the sequence takes a few weeks. Learning to follow it under pressure takes a few hundred recorded trades, which for a trader taking one or two a day is six months to a year. The record is what shortens it.
Which timeframe should a beginner trade?
Bias on the daily, levels on the 4-hour, triggers on the 15-minute or 1-hour. Lower than that, spreads and noise eat the edge; higher, there are too few trades to learn from.
Can the steps be automated?
Steps 1 and 2 can be prepared by tools; step 5 is arithmetic any calculator does. Steps 3, 4, 6 and 7 are judgement and discipline, and the record in step 7 is what teaches the judgement.
Everything on SMC Terminal is analysis and education, not a recommendation to buy or sell. Prices and figures in the example are illustrative. Trading carries a substantial risk of loss. Manage your risk.