Risk-to-Reward Ratio in Forex: How to Calculate and Evaluate It
Risk-to-reward is the one number that decides whether a strategy can make money at all, and it is usually quoted wrongly. This guide shows the calculation step by step, the win rate each ratio needs to break even, how to size a position from it, and the three ways traders quietly destroy a good ratio after entry.
A trader who wins 70% of the time can lose money. A trader who wins 35% of the time can be very profitable. The difference is one number — the ratio of what a trade can make to what it can lose — and it is set before the trade, at the moment the stop and the target are chosen. Everything about whether a method survives is downstream of that number. This guide is the arithmetic, then the evaluation: what ratio a strategy needs, how to size from it, and how it gets ruined in practice.
The calculation
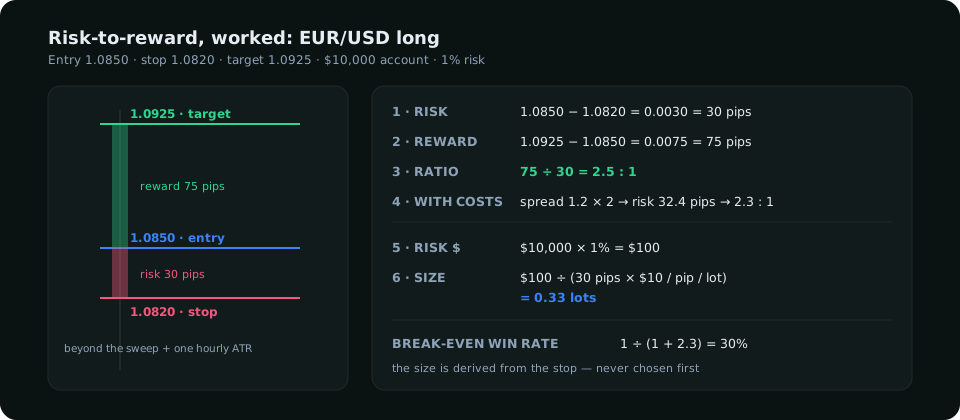
Three prices: entry, stop and target. Risk is the distance from entry to stop; reward is the distance from entry to target. The ratio is reward divided by risk, written as "R:R" or as a multiple of R.
| Step | Long example (EUR/USD) | Short example (XAU/USD) |
|---|---|---|
| Entry | 1.0850 | 4,212.0 |
| Stop | 1.0820 | 4,226.0 |
| Target | 1.0925 | 4,170.0 |
| Risk (entry − stop) | 30 pips | $14.0 |
| Reward (target − entry) | 75 pips | $42.0 |
| Ratio (reward ÷ risk) | 2.5 : 1 | 3.0 : 1 |
Two details that change the number more than traders expect. First, spread and commission are part of the risk: on a 30-pip stop with a 1.2-pip spread paid twice, the real risk is 32.4 pips and the ratio is 2.3 : 1, not 2.5. On a 10-pip scalp it is the difference between 2 : 1 and 1.4 : 1. Second, the stop is where the idea is wrong, not where the loss is comfortable. A stop moved closer to improve the ratio is a stop that gets hit by noise; the ratio looks better and the win rate collapses.
The win rate each ratio needs
A strategy breaks even when the wins pay for the losses. With a ratio of R, the break-even win rate is 1 ÷ (1 + R). The table is worth memorising.
| Ratio | Break-even win rate | Win rate for +0.3R per trade |
|---|---|---|
| 0.5 : 1 | 66.7% | 86.7% |
| 1 : 1 | 50.0% | 65.0% |
| 1.5 : 1 | 40.0% | 52.0% |
| 2 : 1 | 33.3% | 43.3% |
| 3 : 1 | 25.0% | 32.5% |
| 4 : 1 | 20.0% | 26.0% |
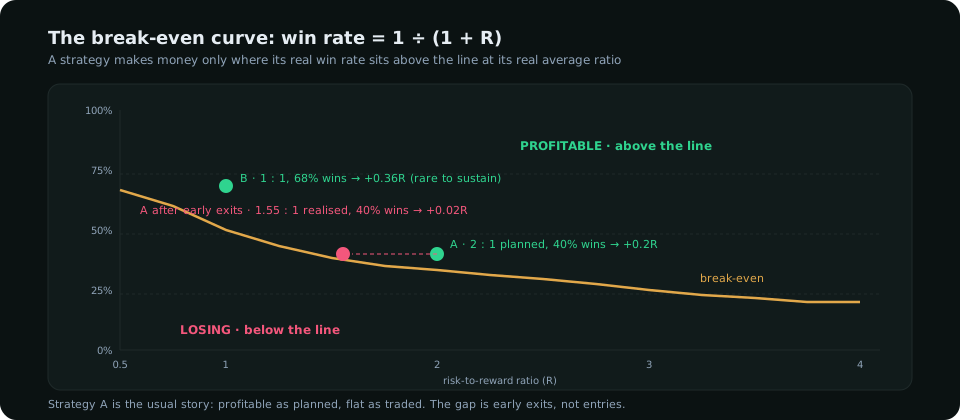
The last column is the useful one: the win rate needed to earn a modest 0.3R per trade after costs. A method that plans 2 : 1 setups needs to win about 43% of them to be worth running. A method that plans 1 : 1 needs 65%, which very few discretionary approaches sustain. This is why the sweep-shift-retest style of entry — which places the stop just beyond a sweep and targets the opposite pool — tends to produce 2.5 : 1 or better by construction: the geometry of the setup does the work.
Expectancy: the ratio and the win rate together
Expectancy per trade = (win rate × average win) − (loss rate × average loss), in R. A strategy winning 40% at an average 2.2R and losing 60% at 1R has an expectancy of 0.4 × 2.2 − 0.6 × 1 = +0.28R. Over 100 trades risking 1% each, that is roughly 28% before compounding and costs. The same strategy at an average 1.6R (the ratio most traders actually achieve after early exits) has an expectancy of 0.04R — effectively zero. The gap between the planned ratio and the realised ratio is where most accounts go.
From ratio to position size
The ratio tells you whether to take the trade. The stop distance tells you how big. The two are separate decisions, and the second is mechanical:
Position size = (account × risk per trade) ÷ (stop distance × value per pip per lot)
For the EUR/USD example on a $10,000 account risking 1%: $100 ÷ (30 pips × $10 per pip per standard lot) = 0.33 lots. For the gold example: $100 ÷ ($14 × $100 per dollar per lot) = 0.07 lots. The ratio was 2.5 and 3; the sizes differ by five times because the instruments differ. Sizing by habit ("I always trade 0.5 lots") ignores this and is the most common way a correct ratio produces an incorrect loss. The risk management guide covers exposure across correlated pairs, which is the next layer.
How a good ratio gets destroyed after entry
- Taking profit early. The planned target was 75 pips; the trade is up 40 and "it might come back". Closing there turns a 2.5 : 1 setup into 1.3 : 1 while leaving the losses at full size. Over a hundred trades this alone can flip a profitable method negative. If you want to take partial profit, decide the rule in advance (half at 1R, rest at target) and compute the blended ratio honestly.
- Moving the stop away. Price approaches the stop and the stop is widened "to give it room". The risk doubles, the ratio halves, and the trade that needed to be wrong gets to be wrong twice as expensively.
- Moving the stop to break-even too soon. This feels like free safety and is a hidden cost: a stop moved to entry inside the sweep's range is taken by noise in trades that would have reached the target. Measure how often your break-even stops are hit and the trade then goes on to win; if it is more than a third of the time, the rule is costing you the ratio.
Evaluating a ratio before you take it
- Is the target a real level? A pool of liquidity, a prior high, the far side of a range — somewhere price has a reason to go. A target set at "2R because that gives a nice ratio" has no reason to be reached.
- Is the stop beyond the invalidation? Beyond the sweep, beyond the zone, with at least one ATR of room on an hourly chart. A stop placed for the ratio rather than for the structure produces a beautiful ratio and a terrible win rate.
- Does the context support the target? A 3 : 1 long into a market where speculators are at a record net long and the dollar's drivers are turning is a 3 : 1 ratio with a reduced chance of ever seeing the target. The ratio is geometry; the data is probability. Both matter, and only one of them is on the chart.
Keep the ratio on every trade record — planned and realised, side by side. After fifty trades the gap between the two columns is the most honest performance review you will get, and closing it is usually worth more than any new entry technique.
Everything on SMC Terminal is analysis and education, not a recommendation to buy or sell. Examples use illustrative prices and standard pip values; check your broker's contract specifications. Trading carries a substantial risk of loss. Manage your risk.