COT Report Explained: How to Read Commitment of Traders Data
The Commitment of Traders report is free, weekly and almost always read wrong. This is the report itself — the versions, the release schedule, every column and what it means, the five mistakes that make it useless, and a worked read of this week's gold numbers.
Every Friday at 3:30pm Eastern time the Commodity Futures Trading Commission publishes a table of who holds what in every major US futures market — currencies, metals, energy, indices, bonds, grains. It is the only public, regulator-collected record of positioning in the world, and it has been free since 1962. Most traders have heard of it. Very few have read a row of it.
This guide is about the report itself: which version to use, when it is published and what that timing means, what every column is, the mistakes that make it worthless, and a worked read of gold's row this week. For the formula that turns the raw numbers into a 0–100 score, see The COT Index Explained.
Three versions of the same report
- Legacy (the one most traders mean): three groups — commercial, non-commercial and non-reportable. The longest history, which is why it is the one used for percentile and index calculations. The terminal's COT Positioning tab is built on it.
- Disaggregated: splits commercials into producers / merchants and swap dealers, and speculators into managed money and other reportables. More detail for commodities; history only from 2006.
- Traders in Financial Futures (TFF): for currencies, rates and indices — dealers, asset managers, leveraged funds, other. Useful for seeing hedge funds (leveraged) separately from real-money managers.
Each version comes as "futures only" or "futures and options combined". Use futures only unless you have a reason not to; it is cleaner and it is what the historical studies used.
The schedule, and why it matters
Positions are measured as of the close on Tuesday and published on Friday. The report you read on Friday evening is three days old, and by the following Thursday it is nine days old. This is fine for what the report is good at — posture that changes over weeks — and fatal for what people try to use it for — timing a move that happens on Wednesday. Think of it as the weather the market walked into the week with.
Every column, explained
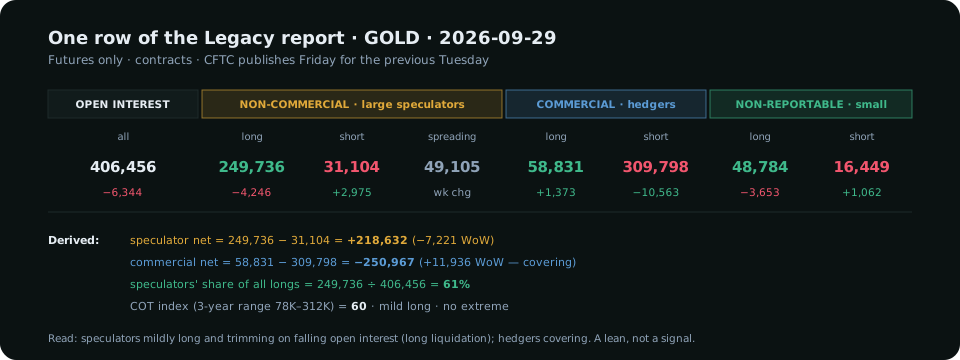
| Column | Meaning | Gold, 2026-09-29 |
|---|---|---|
| Open interest | All contracts outstanding — the size of the market | 406,456 |
| Non-commercial long / short | Large speculators' directional positions | 249,736 / 31,104 |
| Non-commercial spreading | Speculators long one month and short another — not directional | 49,105 |
| Commercial long / short | Hedgers' positions (producers, refiners, bullion banks) | 58,831 / 309,798 |
| Non-reportable long / short | Accounts below the reporting threshold — retail and small funds | 48,784 / 16,449 |
| Changes | Each column's difference from the previous Tuesday | NC net −7,221 |
Two derived numbers do most of the work. Net position = long − short for a group (speculators: +218,632). Share of open interest = long ÷ open interest (speculators are 61% of all longs here). The absolute numbers mean nothing on their own; the comparison with the same market's history is everything.
How to read a row in five steps
- Which way are speculators leaning? Net long or net short. In gold they are almost always net long; the question is how much.
- How crowded, compared to this market's own past? Rank today's net against three years of nets. The COT index (0 = three-year low, 100 = three-year high) is the standard way; gold reads 60 this week.
- What changed this week, and what did open interest do? Speculators cut 7,221 with open interest down 6,344: longs leaving, not shorts arriving. Long liquidation, moderate.
- Where are the commercials? Net short 250,967 and covering (+11,936). Hedgers buying into the dip. They are usually early and usually right at turns.
- Do the groups disagree at extremes? Not this week — nobody is at a three-year extreme. The strongest signal the report gives is commercials at one extreme while speculators are at the other; it is absent here, which means positioning is not the driver.
The read: speculators mildly long and trimming, hedgers covering, no extreme. A bullish lean that has lost some momentum. That is exactly as far as the report can take you — the entry is a chart problem, and the sweep-and-shift method picks it up from here.
Five mistakes that make the report useless
- Reading absolutes. "Speculators are net long 218k" tells you nothing until you know the range was 78k–312k.
- Treating extremes as signals. An index above 90 can persist for months in a strong trend. It raises reversal risk; it does not schedule the reversal.
- Ignoring open interest. Net rising on falling open interest is covering, not conviction.
- Mixing report versions. Managed money (Disaggregated) and non-commercial (Legacy) are not the same number. Pick one and keep its history.
- Using it to time. It is Tuesday's data on Friday. Use it to decide which side of the next sweep to be on, never when.
Where to get it and how to keep it
The CFTC publishes every version at cftc.gov and through a public data API with the full archive back to 1986 for most markets. Keeping three years of weekly rows per market is what makes the index and percentile calculations possible, and it is what the terminal does for 17 markets every Friday evening — the Positioning tab shows the current row, the index per group, the week's changes and a three-year table you can download. If you build your own, store the gross columns, not just the nets: the spreading and small-trader figures are what you need later and the ones everyone forgets to save.
Everything on SMC Terminal is analysis and education, not a recommendation to buy or sell. Verify anything decision-critical at cftc.gov. Manage your risk.