How to Analyse Today's Forex Market: A Repeatable Daily Workflow
"Forex market analysis today" is a question most traders answer by reading other people's opinions. This guide replaces that with a 25-minute routine you can run yourself every morning — overnight recap, calendar, positioning, structure, levels, plan — in a fixed order with a fixed output, so the day's analysis is the same quality whether the market is quiet or wild.
Analysing today's forex market is a routine, not a forecast. Done the same way every morning, in the same order, it takes about 25 minutes and produces one page: what moved overnight and why, what is scheduled, which way the bias points for each pair on watch, where the levels are, and what would make you trade. Done differently every day — a scan of social media, a glance at a few charts, a feeling — it takes longer and produces nothing reusable. This guide sets out the routine, step by step, with the output each step must produce and a one-page sheet that holds it.
The routine, with timings
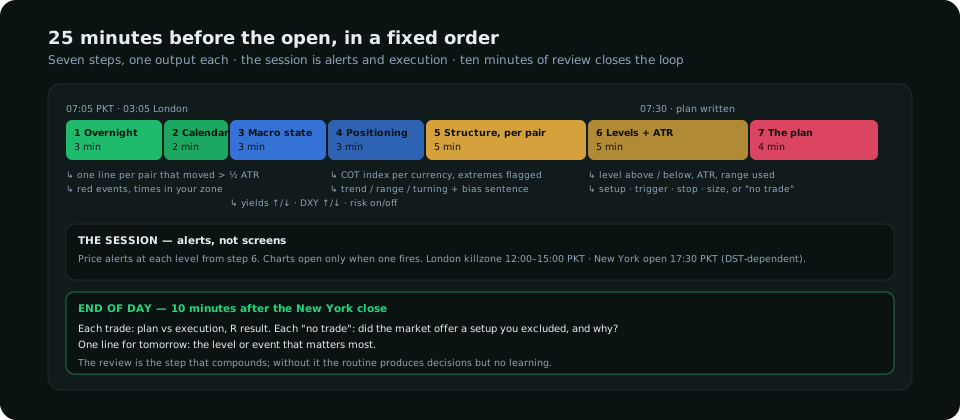
| Step | Minutes | Question | Output on the sheet |
|---|---|---|---|
| 1. Overnight recap | 3 | What moved in Asia, and why? | One line per pair that moved more than half its ATR |
| 2. Calendar | 2 | What is scheduled, and when? | Red events with times in your zone |
| 3. Macro state | 3 | Which way are yields, the dollar and risk pointing? | Three words: yields up/down, DXY up/down, risk on/off |
| 4. Positioning | 3 | Where is the crowd, per currency? | COT index per currency; any extreme flagged |
| 5. Structure | 5 | Trend, range or turning, on the daily and 4-hour? | One state word per pair, plus the bias sentence with its condition |
| 6. Levels and ATR | 5 | From where, and how far is normal? | The level above and below, the daily ATR, the range already used |
| 7. The plan | 4 | What would make me trade? | Setup, trigger, stop, size per pair — or "no trade" |
Step 1 — Overnight recap
Open the pairs on watch on the 1-hour chart and look at the Asian session. The question is not what happened but whether anything happened: a pair that moved more than half its daily ATR overnight has used part of today's range and probably has a reason (a Japanese data print, a China headline, a risk move in equities). One line each, cause included if known. A quiet Asia is also a line — it means the range is intact for London.
Step 2 — Calendar
The economic calendar for the day, filtered to high-impact events, converted to your own time zone. The output is a list of times at which the plan may need to pause: no new entries in the fifteen minutes around a red print, and a decision on whether existing positions ride through it. Traders in Pakistan and the Gulf can use the session clock for the killzone times in PKT and GST.
Step 3 — The macro state
Three reads, each a direction: the US 10-year yield and the 2-year (up or down on the week), the dollar index (above or below last week's close), and risk appetite (equity futures and the yen — a falling yen cross with falling equities is risk-off). These set the tide that the rest of the analysis works within; the Treasury yields article explains what each read implies for the dollar and gold.
Step 4 — Positioning
The COT index per currency from last Friday's report — a number from 0 to 100 that says how crowded the speculative position is. This does not change during the week, so the step is quick: note any currency above 80 or below 20, because a crowded position changes how a pair responds to news (good news stops working; bad news works twice). The net positions guide covers the reading.
Step 5 — Structure
For each pair, the daily and 4-hour structure in one word: uptrend, downtrend, range, or turning (a fresh change of character that is not yet a new trend). Then the bias sentence with its condition — "GBP/USD bullish while the 4-hour holds 1.2640". A pair in a range gets a range plan or no plan; a pair that is turning gets patience.
Step 6 — Levels and ATR
The nearest level above and below the current price on the 4-hour: the demand or supply zone, the swing point, the prior day's high and low, the round number. Then the daily ATR and how much of it has already been used overnight — if EUR/USD has moved 45 pips of a 60-pip ATR before London, the day's "normal" range is mostly spent and a breakout plan is weaker. The ATR guide covers the arithmetic.
Step 7 — The plan
For each pair with a bias and a level within reach: the setup (buy the pullback to 1.2640 demand), the trigger (a 15-minute sweep and reclaim, or a break of structure), the stop (beyond the sweep plus 0.4 ATR), the size (risk ÷ stop distance), the first target. For every other pair: "no trade", written down, which is what stops the afternoon impulse. The step-by-step guide explains each element.
The one-page sheet
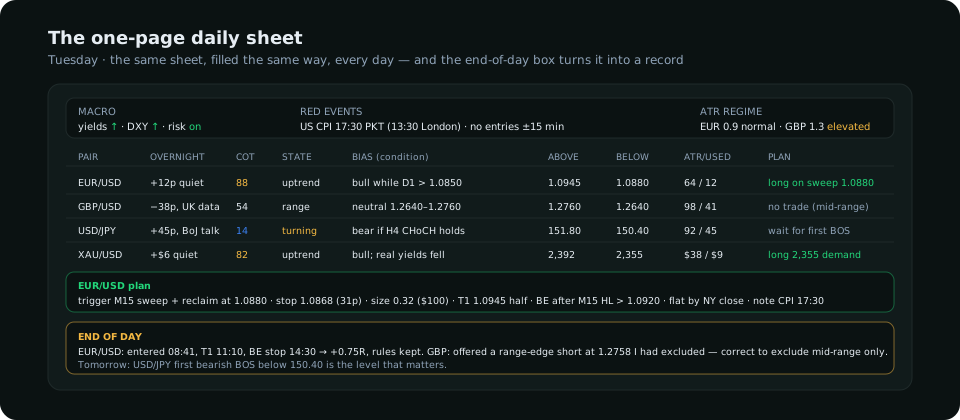
The sheet is the discipline. A trader who writes "no trade" for three pairs at 07:30 does not improvise a trade on one of them at 14:00. A trader who writes the stop before the entry does not widen it afterwards. Over weeks the sheets become the record that the strategy choice depends on: which structures, which sessions and which pairs actually paid.
During the session: alerts, not screens
Once the sheet is written, the chart's job is to tell you when a level is reached. Price alerts at each level from step 6, on the platform or the phone, mean the session is spent waiting rather than watching, and that the trigger is assessed fresh when it arrives instead of anticipated for an hour. The London killzone and the New York open are the windows in which most triggers occur; the London session guide covers the preparation for the first.
End of day: ten minutes
After the New York close, the review box: for each trade, plan versus execution and the R result; for each "no trade", whether the market offered a setup you had excluded and why. Then one line for tomorrow — the level or event that matters most. This is the step that compounds; without it the routine produces decisions but no learning.
Where the terminal fits
Steps 3 to 6 are what SMC Terminal's Home tab prepares each morning: the macro regime, the COT index per currency, the structure state and the levels per pair, with the calendar's red events in the viewer's own time zone. The routine above is the same whether the inputs are assembled by hand from FRED, the CFTC and a charting platform or read from a dashboard; what matters is that it runs in order and ends in a written plan.
Frequently asked
How long should daily forex analysis take?
Twenty to thirty minutes before the session for four to six pairs, plus ten minutes of review at the close. Longer usually means the routine has no fixed order.
Which pairs should be on the daily sheet?
The pairs that move in the session you trade and that you have a record on. For a London-session trader that is typically EUR/USD, GBP/USD, a yen cross and gold.
Should I read other analysts' daily forecasts?
After the sheet is written, not before, and only to check whether they see a level or an event you missed. Opinions read first become the bias; the routine exists so that the data is.
Everything on SMC Terminal is analysis and education, not a recommendation to buy or sell. Timings and figures are illustrative. Trading carries a substantial risk of loss. Manage your risk.