A Rules-Based COT Trading Strategy: Positioning, Price and Risk
A COT report trading strategy fails when positioning is asked to do what it cannot: time entries. This one gives it the job it does well, setting the bias and the conviction, and hands timing to price structure and sizing to a fixed risk rule. The result is five written rules: the positioning condition, the price trigger, the entry, the stop, and the exit, with a worked euro trade and the numbers a backtest of it should report.
A COT report trading strategy has to respect what the report is: a weekly, Tuesday-stamped snapshot of futures positioning, published Friday. It cannot time an entry, it cannot see this morning's flow, and it stays at an extreme for months in a strong trend. What it does better than any other forex input is say which side of a market is crowded and which has room, and whether the crowd added or reduced this week. A strategy built around that gives positioning the bias and the conviction, price structure the timing, and a fixed rule the size. This guide writes the five rules out in full, works a euro trade through them, and lists what a backtest of the strategy should report before it is traded.
The five rules
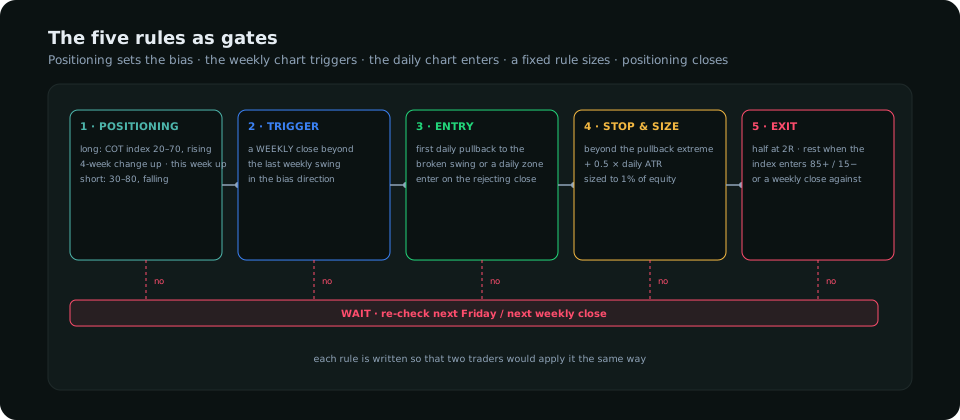
| Rule | Long | Short |
|---|---|---|
| 1 · Positioning condition | Speculative COT index 20–70 and higher than four weeks ago; this week's net change positive | Index 30–80 and lower than four weeks ago; net change negative |
| 2 · Price trigger | A weekly close above the last weekly swing high | A weekly close below the last weekly swing low |
| 3 · Entry | First daily pullback to the broken swing or to a daily demand zone beneath it; enter on the daily close that rejects the zone | Mirror: pullback to the broken swing or a daily supply zone; enter on the rejecting daily close |
| 4 · Stop and size | Stop beyond the pullback's extreme plus 0.5 × daily ATR; position sized so the stop is 1% of equity | |
| 5 · Exit | Half the position at 2 R; the remainder when the COT index enters the crowded band (above 85 for longs, below 15 for shorts) or a weekly close against the trade, whichever first | |
Why each rule is shaped as it is
Rule 1 excludes the extremes deliberately. The intuitive COT strategy, fading crowded readings, is right eventually and stopped out repeatedly in the meantime, because crowded markets stay crowded. This strategy instead enters while the crowd is building, mid-range and rising, which is the phase in which trend-following money is joining and has room to keep joining. The four-week comparison catches the direction of travel; the weekly change confirms it. The COT index guide explains the 0–100 rescaling that makes the bands comparable across markets.
Rule 2 is the timing the report cannot supply. Positioning can be building for months before price confirms; the weekly structure break is the point at which the market agrees. The break of structure guide defines the swing; a weekly close is required because weekly wicks through swings are routine sweeps.
Rule 3 avoids the breakout candle. The first pullback after a weekly break is where the trade's reward-to-risk is acceptable; chasing the break gives a stop too far away. The rejecting daily close is the confirmation that the pullback is a pullback.
Rule 4 keeps every trade the same size in risk terms. The ATR buffer keeps the stop clear of the pullback extreme's wick, which is where stops cluster. The risk per trade guide covers why 1% and not more.
Rule 5 uses positioning for the exit it is good at: the trade is closed when the crowd that was building has become the crowd that is full. The weekly close against the trade is the structural failure exit. Taking half at 2 R pays for the trade and lets the remainder run the trend, which in a COT-driven move is often several months.
A worked EUR/USD trade
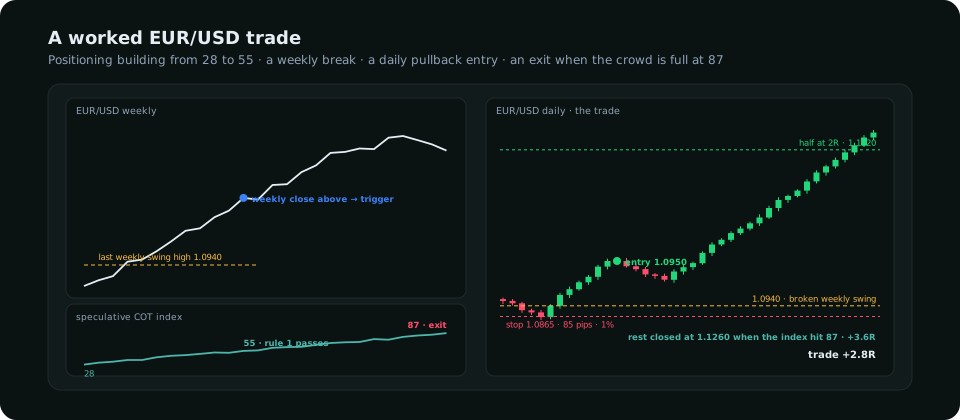
Week 0: the euro's speculative COT index is 55, up from 28 eight weeks earlier, with this week's net change +11,000 contracts. Rule 1 passes for a long. The weekly chart closes at 1.0965, above the last weekly swing high at 1.0940. Rule 2 passes. Over the next five days price pulls back to 1.0925, tests the broken swing, and on day five prints a daily close at 1.0950 with a lower wick rejecting the level. Rule 3: entry 1.0950. Daily ATR is 70 pips; the pullback low is 1.0918; stop at 1.0918 − 35 = 1.0883, call it 1.0865 to sit below the round level, a risk of 85 pips. Rule 4: on a 20,000-dollar account, 200 dollars of risk over 85 pips is about 0.23 lots. Rule 5: half closed at 1.1120 (+2 R); the remainder runs until, eleven weeks later, the COT index prints 87 and the position is closed at 1.1260 (+3.6 R on that half). Trade result +2.8 R. The net positions article shows what the index was tracking underneath.
What to backtest before trading it
The strategy fires perhaps eight to fifteen times a year across the eight currency futures, so a meaningful test needs several years. Report, as the backtesting guide sets out: trade count, win rate (expect 40–50%), average R (expect 1.5–2.5), expectancy after costs, maximum drawdown in R, the longest losing streak, and the result split by currency and by year. Two sensitivity checks matter: shift the index bands by 10 points each way and confirm the result does not collapse, and replace the weekly trigger with a daily one to see how much the timing rule is contributing. Check the commercial and managed money lines as alternative inputs for rule 1; in the currencies the speculative line is usually sufficient.
Mistakes that break it
- Fading the extremes. Rule 1 excludes them for a reason; "crowded" is a condition for exiting, not entering.
- Entering on the report. Friday's report is not a trigger; the weekly close is. A strategy that enters on positioning alone is early by weeks.
- Overriding rule 5. Holding past the crowded band because the trend "looks strong" is how the strategy's best trades give back half their gains.
- Trading all eight currencies as separate bets. Four dollar pairs long is one dollar trade; count exposure by currency.
- Reading the dollar directly. The dollar index future's COT is thin; assemble the dollar view from the other currencies' nets, as the forex COT guide describes.
Frequently asked
Can you trade using the COT report alone?
Not well. The report sets a bias and a conviction level; it cannot time an entry or place a stop. A strategy that pairs it with a price trigger and a fixed risk rule uses it for what it is good at.
How often does a COT trading strategy trade?
With the rules above, roughly one to two trades a month across the major currency futures, each typically held for several weeks to a few months.
Which COT index level is bullish?
In this strategy, 20 to 70 and rising: the crowd is building with room to add. Above 85 the crowd is full and the strategy exits rather than enters.
Everything on SMC Terminal is analysis and education, not a recommendation to buy or sell. Figures in the example are illustrative. Trading carries a substantial risk of loss. Manage your risk.