How Much Should You Risk Per Forex Trade? Understanding Risk Limits
Forex risk per trade is the one number that decides whether a strategy with an edge actually survives long enough to show it. This guide works through what different risk levels do to an account across a normal losing streak, why the right number depends on win rate and reward-to-risk rather than confidence, and how the per-trade limit sits inside daily, weekly and exposure limits that matter just as much.
Ask ten traders how much to risk per forex trade and nine will say one or two percent, and most of them will then risk more than that on the trades they feel sure about. The number matters less as a rule than as a consequence: it is what decides how deep the drawdown goes during the losing streak every strategy eventually produces, and therefore whether the trader is still trading when the edge reasserts itself. This guide works through the arithmetic, shows why the right figure depends on the strategy's statistics rather than the trader's confidence, and sets the per-trade number inside the other limits that stop a bad day from becoming a bad month.
What a losing streak does at each risk level
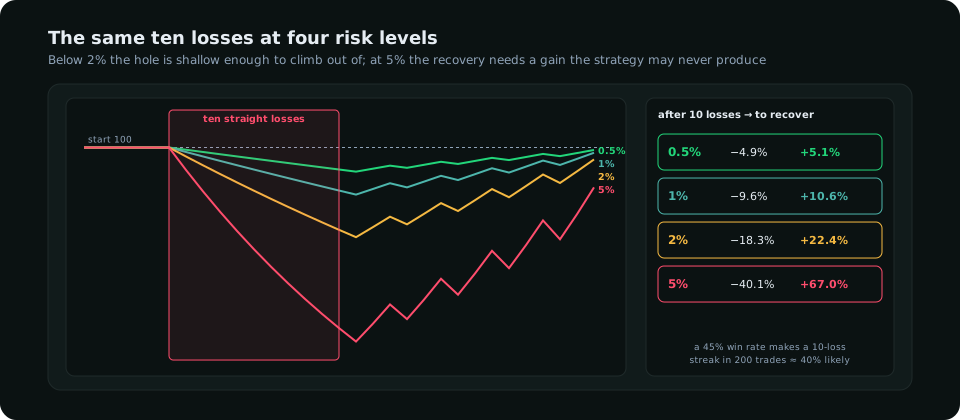
| Risk per trade | After 10 straight losses | Gain needed to recover | Probability of 10 straight losses in 200 trades (45% win rate) |
|---|---|---|---|
| 0.5% | −4.9% | +5.1% | About 40% — it will happen |
| 1% | −9.6% | +10.6% | |
| 2% | −18.3% | +22.4% | |
| 5% | −40.1% | +67.0% |
The last column is the point most traders miss. With a 45% win rate, a ten-loss streak somewhere in 200 trades is not an unlikely disaster; it is close to a coin flip, and over a trading career it is a certainty. The question is therefore not "will I have a bad streak" but "what will my account look like when I do", and the per-trade risk is the only lever that controls the answer. Losses also compound against you: each loss is taken on a smaller balance, so ten 2% losses cost 18.3%, not 20%, but the recovery is on the smaller base, so it needs 22.4%.
The ceiling depends on the strategy, not the trader
A strategy's win rate and average reward-to-risk together set how volatile its returns are, and that volatility sets the risk per trade it can bear. The classic formula for the growth-maximising fraction (Kelly) is f = W − (1 − W) / R, where W is the win rate and R the average win divided by the average loss. For a 45% win rate at 2 : 1 reward-to-risk, f = 0.45 − 0.55 / 2 = 17.5%. That is the fraction that maximises long-run growth if the statistics are exactly known, and it produces drawdowns of 50% or more along the way. Nobody's statistics are exactly known, and nobody can trade through a 50% drawdown without changing their behaviour. The practical rule is a small fraction of Kelly, a tenth to a quarter, which for most discretionary strategies lands between 0.5% and 2%. A 60% win rate at 1.5 : 1 gives f = 33%, a quarter of which is 8%, which is still far too high for the uncertainty in the estimate. Use the formula to confirm that 1% is comfortably inside the ceiling, not to justify 5%.
Choosing the number
- 0.25–0.5%: a new strategy, a new market, or the first three months live. The edge is unproven and the point is to gather statistics cheaply.
- 0.5–1%: a proven strategy traded discretionarily. This is where most consistent traders sit; it keeps the ten-loss drawdown under 10%.
- 1–2%: a strategy with a documented win rate above 50% and reward-to-risk above 1.5, traded mechanically, with the per-day and per-week limits below enforced.
- Above 2%: a bet that the next trade is special. It is not; the statistics do not know which trade you are confident about.
Whatever the number, it is a fixed percentage of current equity, recalculated after each closed trade, which means the position shrinks during a drawdown and grows during a run. That single rule does more to keep a trader alive than any stop-placement technique. The position-size calculator guide turns the percentage into lots.
The ladder of limits
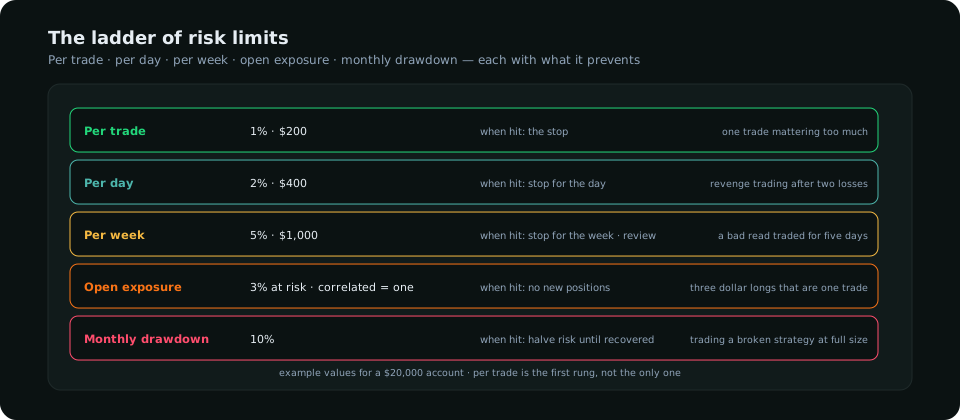
| Limit | Typical value | When hit | What it prevents |
|---|---|---|---|
| Per trade | 0.5–1% of equity | The stop | One trade mattering too much |
| Per day | 2–3× per-trade | Stop trading for the day | Revenge trading after two losses |
| Per week | 5% of equity | Stop for the week; review | A bad read being traded for five days |
| Open exposure | 3% total at risk, correlated positions counted once | No new positions | Three dollar longs that are one trade in disguise |
| Monthly drawdown | 10% | Halve risk per trade until recovered | Trading a broken strategy at full size |
The exposure limit is the one traders forget. EUR/USD short, GBP/USD short and gold short at 1% each is not 3% spread across three ideas; it is 3% on one idea, the dollar going up, and a soft US print closes all three at once. Count correlated positions as one when checking the exposure rung. The risk management guide covers correlation in more depth.
When to go lower than your number
Risk is reduced, never raised, in response to conditions. Halve it after a losing week, when trading a pair or session you trade rarely, around a release you have decided to trade through, and for any trade whose stop had to be widened to fit the structure (a wider stop at the same risk is a smaller position, which is correct, but a wider stop that tempted you to raise the risk to keep the size is the wrong instinct). Return to the full number only after the equity high is recovered or after a set count of trades, not after one winner. The reward-to-risk article covers the other half of the expectancy; this one is about surviving to collect it.
A worked month
A 20,000-dollar account at 1% per trade, 2% per day, 5% per week. Week one: eight trades, three winners at 2R, five losers; net +1R, +200 dollars. Week two: Monday two losses, day limit hit, stop; Tuesday to Friday six trades, two winners at 2.5R, four losers; net +1R. Week three: a six-loss streak across Monday and Tuesday hits the day limit twice; Wednesday a 3R winner; net −3R, −600 dollars, which is 3% and inside the week limit. Week four: five trades, three winners, net +4R. Month: +3R, about +600 dollars, or 3%, with a maximum drawdown of 4% along the way. The same month at 3% per trade would have shown a 12% drawdown in week three and, for most traders, a different week four.
Frequently asked
Is 2% risk per trade too much?
For a proven, mechanically traded strategy with a win rate above 50%, 2% is defensible with day and week limits in place. For a discretionary trader or a new strategy, 1% or less keeps the inevitable streak survivable.
Should risk per trade change with confidence?
No. Confidence is not information the statistics have. If some setups genuinely perform better, prove it in the journal first, then give that setup class its own fixed number.
How do I calculate risk per trade in lots?
Account equity × risk percentage = risk in currency; divide by the stop distance in pips × the pip value per lot. The lot size guide has the formula for each pair type.
Everything on SMC Terminal is analysis and education, not a recommendation to buy or sell. Figures in the example are illustrative. Trading carries a substantial risk of loss. Manage your risk.