The COT Index Explained: How to Turn the CFTC Report into a Weekly Bias (With the Formula)
The Commitments of Traders report is published every Friday and read by almost nobody correctly. This is the COT index formula, what each trader group means, the thresholds that matter, and how to turn the whole thing into one weekly bias per market.
Every Friday at 3:30pm Eastern the CFTC publishes the Commitments of Traders report: how many futures contracts each category of trader held long and short as of the previous Tuesday. It is free, it covers every major currency, metal, index and energy contract, and it is the only public record of what large, regulated participants are actually positioned for rather than what they say.
It is also almost useless in its raw form. A number like "non-commercial long 249,736" tells you nothing until you know whether that is a lot. This post gives you the one calculation that makes it useful, the thresholds that matter, and a way to turn the whole report into a single weekly bias per market.
The three groups, in trader's terms
The Legacy report splits open interest into three categories. The official definitions are about reporting thresholds; what matters is who they are in practice.
| Group | Who they are | How they trade |
|---|---|---|
| Non-commercial (large speculators) | Hedge funds, CTAs, large managed money | Trend followers. Net position tracks price. They are most long at tops and most short at bottoms. |
| Commercial (hedgers) | Producers, refiners, banks hedging client flow | Fade the trend. They sell into strength and buy into weakness because they are hedging real business, not speculating. |
| Non-reportable (small traders) | Accounts below the reporting threshold | Retail. Most crowded at the wrong moments; useful as a contrary read at extremes. |
Two things follow. First, speculators and commercials are nearly mirror images — one group's net long is the other's net short — so you only need to read one of them carefully. Second, "speculators are net long" is not a bullish statement on its own. Speculators are net long gold almost permanently. The question is always how long, compared to their own history.
The COT index formula
The COT index answers that question. It places this week's net position on a 0–100 scale between the lowest and highest net positions of the trailing window — three years is the convention.
COT index = (net today − lowest net in window) / (highest net in window − lowest net in window) × 100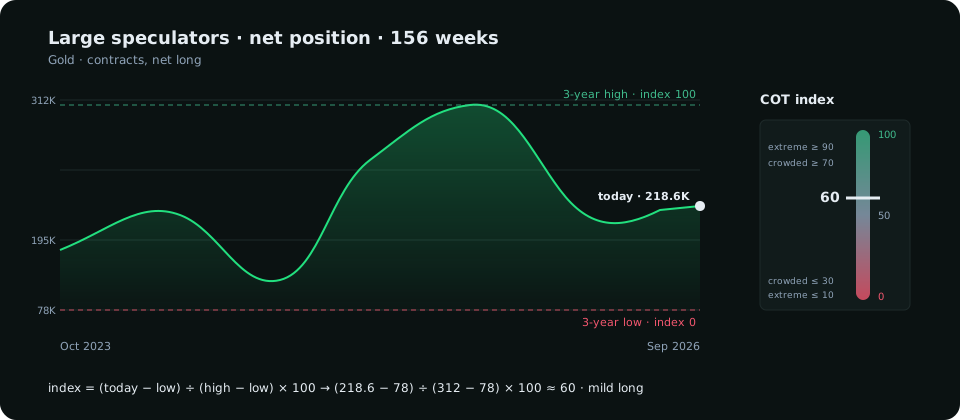
Worked example from this week's gold report. Large speculators are net long 218,632 contracts. Over the last 156 weeks their net ranged from roughly 78,000 to 312,000. So:
(218,632 − 78,000) / (312,000 − 78,000) × 100 ≈ 60An index of 60 means speculators are moderately long by their own standards — nowhere near the crowding of early spring, when the same calculation read above 90.
The thresholds that matter
The index is a percentage of a range, so the extremes are where the information is. These are the levels the terminal uses, and they match what most systematic COT research has settled on:
- Above 90 or below 10: a three-year extreme. The trend-following crowd is all in. Reversals do not start on a schedule, but when they start from here they are violent, because there is nobody left to add.
- 70–90 or 10–30: crowded. The trend is mature. Pullbacks are deeper; breakouts fail more often.
- 30–70: unremarkable. Positioning is not the driver this week; structure and macro are.
Two refinements make a real difference in practice. Read the week-over-week change alongside the level: an index of 85 with speculators still adding is a trend with momentum; an index of 85 with speculators cutting for two weeks is a top being built. And always check open interest. Net longs rising while open interest falls is short covering, not new buying — the move is weaker than it looks.
The hedgers-against-the-crowd signal
The single strongest read in the report is not any one group's level. It is disagreement at the extremes: commercials near their most short of three years while speculators are near their most long, or the mirror. The hedgers have real business behind their positions and they have been on the right side of the major turns for as long as the report has existed. When they lean hard against the speculative crowd, the turn may still be weeks away — but you know which side of the next liquidity sweep to be on.
Turning it into a weekly bias
Here is the procedure, in the order the terminal runs it:
- Direction from the sign of the speculators' net: long → bullish lean, short → bearish lean.
- Strength from the index: how far from 50. Above 80 or below 20 is strong, 60–80 moderate, otherwise weak.
- Confirmation from the four-week flow: if speculators have been adding in the direction of their net, the bias holds; if they have been cutting, downgrade it one notch.
- Reversal risk from the extremes and the hedgers-against-the-crowd check. At an extreme, the bias is still the trend — but you trade it with tighter targets and you stop adding.
Gold this week by that procedure: bullish lean, weak strength (index 60), downgraded by speculators cutting 7,221 on the week with open interest falling. The honest read is "mildly long, losing momentum" — which is exactly what the H1 chart has been saying.
What the report cannot do
It cannot time anything. Positioning extremes persist for months in strong trends; the index first crossed 90 in gold long before the actual top. Use it as a weight on the scale, never as a trigger. It is also three days old on arrival (Tuesday's data on Friday), so it describes the posture the market carried into the week, not what happened in it. And it covers futures only — it says nothing about spot FX or CFD flow, which is why it is one input to a bias on this terminal and not the bias itself.
The full three-year archive for every tracked market, the index per group, and the week-over-week changes are on the COT Positioning tab, rebuilt every Friday evening when the CFTC publishes.
Everything on SMC Terminal is analysis and education, not a recommendation to buy or sell. Verify anything decision-critical at cftc.gov. Manage your risk.
More from the desk
All posts →