London vs New York: How to Analyse Gold Trading Sessions
Gold trading sessions behave differently enough that one plan cannot cover both: London sets the direction with a sweep of the Asian range, New York delivers the distance around US data and the options expiry, and the hour they overlap is where the day's largest candles print. This guide analyses each session by its share of the daily range, what drives it, how it typically reverses or extends the previous one, and the setup that fits each window.
Gold trading sessions are not three versions of the same market. Asia is where the day's range is first defined and rarely where it is made; London is where that range is swept and the day's direction is chosen; New York is where most of the distance is travelled, usually around a US data release and often reversing or extending what London did. The hour in which London and New York overlap prints the largest candles of the day more often than any other. A trader who knows which session they are in knows what kind of move to expect, which setup fits, and when to stop. This guide analyses each session by its share of the range, its drivers, and the trade it offers.
Share of the daily range
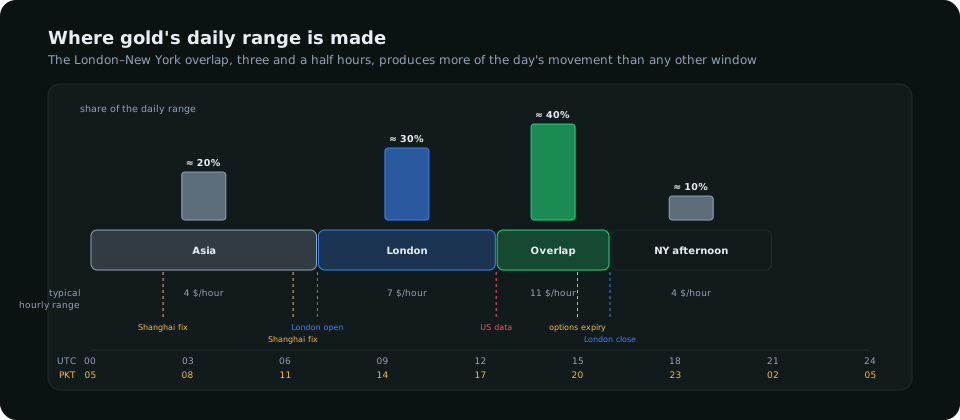
| Session (UTC / PKT) | Share of range | Driver | Character |
|---|---|---|---|
| Asia · 00:00–07:00 / 05:00–12:00 | ≈ 20% | Shanghai fixes at 02:15 and 06:15; physical demand; thin futures volume | Range-bound; defines the Asian high and low |
| London · 07:00–12:30 / 12:00–17:30 | ≈ 30% | European banks and the London bullion desks; the first real volume | A sweep of one side of the Asian range, then the day's first directional leg; a lull from 10:00 |
| Overlap · 12:30–16:00 / 17:30–21:00 | ≈ 40% | US data at 12:30; COMEX open at 13:20; the 15:00 options expiry; the 16:00 London close | The largest candles; continuation or reversal of London's leg |
| New York afternoon · 16:00–21:00 / 21:00–02:00 | ≈ 10% | US equities; positioning into the close | Fades; thin; the day's extremes rarely change |
Asia: the range that gets swept
Asian hours are driven by physical demand and the Shanghai Gold Exchange's two daily fixes, and the futures volume is a fraction of what London and New York bring. The session's job in a day-trading plan is to define the day's first liquidity: the Asian high and low. Trading inside it is low-reward; the range is narrow and the moves out of it are the next session's business. The exception is a day with a Reserve Bank of Australia or Bank of Japan decision or a large Chinese data release, when gold can move 20 dollars before London; otherwise Asia is for marking levels.
London: the sweep and the first leg
The London open brings the first institutional volume of the day, and the first thing it does, most days, is take out one side of the Asian range. That sweep is the London setup: price runs the Asian low (or high), the stops beneath it are filled, and price closes back inside the range on the fifteen-minute chart with a displacement candle. The direction of the sweep is the information: a sweep of the low on a day with a long bias is the entry for the long; a sweep of the high on that day is a shorter, faster trade back to the range's midpoint. London's first leg runs from the sweep to roughly 10:00 UTC, when the session lulls for two hours before the US. The London session guide covers the general session; for gold the sweep is the specific pattern to prepare for. A London session that opens and expands through the Asian range without a sweep gives no setup; the correct response is to wait for New York.
New York and the overlap: the distance
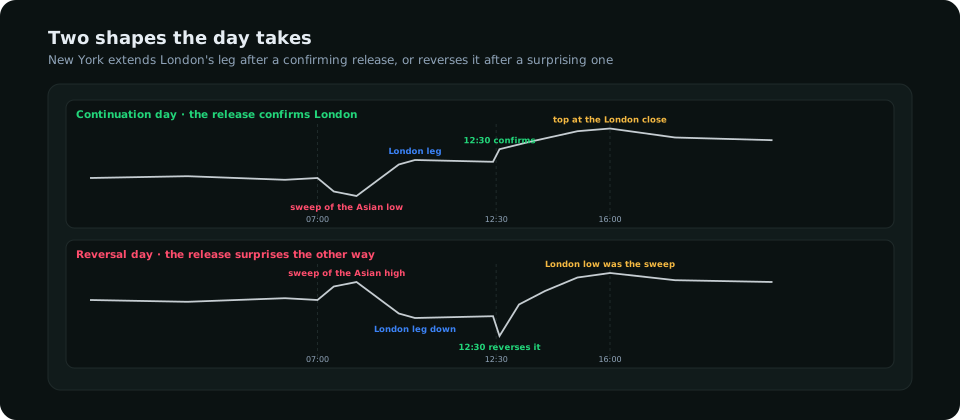
The overlap begins with the 12:30 UTC US releases and ends with the London close at 16:00, and it contains three events that move gold: the release itself, which reprices real yields and the dollar in seconds; the COMEX open at 13:20, which brings the futures volume; and the options expiry at 15:00 New York morning, before which price is drawn toward large strikes and after which it is released. The pattern to read is New York's treatment of London's leg. After a release that confirms London's direction, the overlap continues: price pulls back to the zone London's move started from and runs on to a new extreme, often peaking into the London close. After a release that surprises the other way, the overlap reverses: London's extreme becomes the sweep and the move runs back through the Asian range. The New York session guide sets out the general plan; for gold the 12:30 candle is the hinge, and the rule is never to carry a new position into it.
The afternoon: manage, do not enter
After the London close the European desks are gone, volume thins and gold tracks US equities and the dollar loosely. The day's high and low are usually in place by 16:00 UTC and the afternoon rarely changes them. Moves started after 17:00 tend to retrace into the Asian open. The afternoon is for managing a position taken in the overlap, trailing a stop behind the structure, and being flat by around 20:00 UTC.
Matching the setup to the session
- London: the sweep of the Asian range and the close back inside; stop beyond the sweep; first target the opposite side of the range.
- Overlap, continuation: after the release, the pullback to London's origin zone and the lower-timeframe break out of it; target the next liquidity, usually the previous day's extreme or the round number, with an eye on the 16:00 close as the likely end.
- Overlap, reversal: the release displaces against London; London's extreme is now the sweep; the same reclaim logic as the London setup, the other way.
- Asia and the afternoon: no new entries by default.
The gold day-trading guide builds these into one plan card; the daily bias article supplies the direction that decides which sweep to trade. The killzone clock shows the windows above in Pakistan and Gulf time, which matters because the overlap falls in the evening there and the London sweep around midday.
Frequently asked
Which session is best for trading gold?
The London and New York overlap, 12:30 to 16:00 UTC, produces the most range and the cleanest directional moves. The London open from 07:00 produces the day's first setup, the sweep of the Asian range.
Does gold move in the Asian session?
Modestly: about a fifth of the daily range, mostly around the Shanghai fixes. Its value is in defining the Asian high and low that London sweeps.
What time does gold move the most?
12:30 to 13:30 UTC, around the US data releases and the COMEX open, and again toward 15:00–16:00 UTC, around the options expiry and the London close.
Everything on SMC Terminal is analysis and education, not a recommendation to buy or sell. Figures in the example are illustrative. Trading carries a substantial risk of loss. Manage your risk.