Commercial Traders in the COT Report: What Their Positions Reveal
Commercial traders in the COT report are the hedgers: producers, merchants, processors and banks who hold futures to offset a business exposure, not to speculate. Their net position is usually on the wrong side of the trend and right at the turn. This guide explains who they are, why their positions behave that way, how to read their net against its own history, and the three mistakes that come from treating them as a signal rather than a context.
Every market in the weekly COT report has a group the CFTC calls commercial traders: participants who hold futures to hedge a position in the physical or financial business they run. A gold miner sells futures against ounces it will dig next year; an airline buys crude futures against fuel it will burn; a bank sells euro futures against the euros a client has just bought from it. None of them is trying to call the market, and that is exactly why their positions are informative. They are the counterparty to the speculators, they are forced to act by prices rather than opinions, and when their net reaches a historical extreme it has coincided, more often than any other COT number, with the market turning. This guide explains who they are, why their net behaves as it does, and how to read it without mistaking it for a timing signal.
Who counts as a commercial
| Type | Example | Typical futures position | Why |
|---|---|---|---|
| Producer | Gold miner, oil driller, wheat farmer | Short | Locks in a price for future output |
| Merchant / processor | Refiner, grain elevator, jeweller | Long or short | Hedges inventory bought or sold forward |
| Consumer | Airline, food manufacturer | Long | Locks in a price for future input |
| Bank / dealer (currencies) | FX desk offsetting client flow | Opposite to clients | Flattens the risk from spot trades it has made |
| Swap dealer (disaggregated report) | Bank hedging a commodity index swap sold to a fund | Long | Hedges the swap; economically this is fund money |
The legacy report lumps all of these into one "commercial" line; the disaggregated report, available for commodities, splits producers and merchants from swap dealers. The split matters in gold and crude, where swap dealers' longs are really index-fund demand wearing a hedger's label. The COT report guide walks through both formats.
Why commercials are net short in rising markets
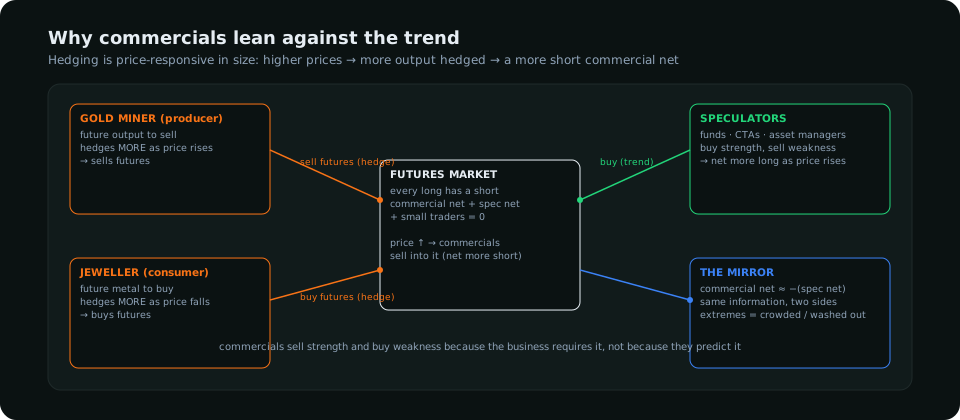
A miner does not hedge because it thinks gold will fall; it hedges because the board wants next year's revenue locked in, and a higher price makes locking in more attractive. So as gold rises, more production is sold forward and the commercial net becomes more short. As gold falls, hedges are lifted at a profit and the net shrinks. The result is a net that is almost always short in gold, more short at highs and less short at lows, and that looks like a contrarian genius when charted against price. It is not forecasting; it is the mechanical consequence of hedging. The same logic, in reverse, applies to consumers, and in currencies the bank line is the mirror of whatever clients are doing. Reading commercials well starts with accepting that the position is a response, not a view.
Reading the net against its own history
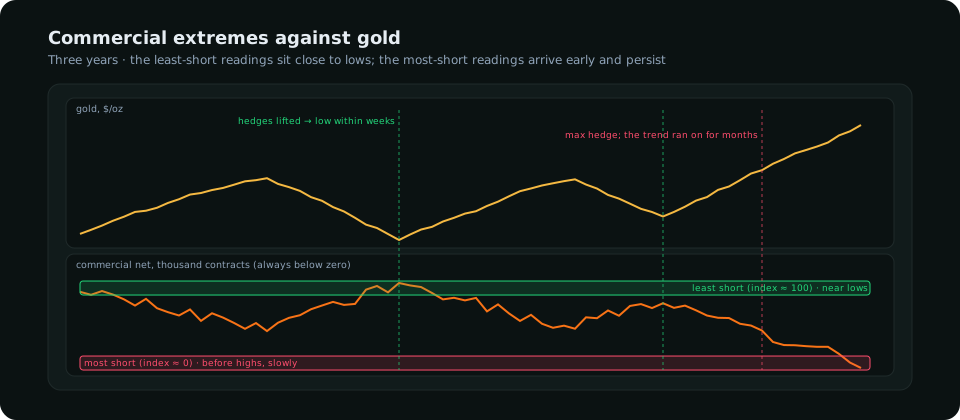
Because the net is structurally short in most commodities, its absolute sign tells you little. The useful reading is where it sits in its own range: the COT index rescales the commercial net over 156 weeks to 0–100. A commercial index near 100 means hedgers are as un-short as they have been in three years: the hedging has been lifted, which happens after prices have fallen far enough that producers no longer want to lock in. That is the "commercials are buying" condition that precedes many bottoms. An index near 0 means hedging is at a three-year maximum, which happens after a long rise, and marks the condition in which rallies start to fail. The net positions article shows the commercial and speculative nets as mirror images, so the two indices carry the same information read from opposite sides.
The asymmetry at tops and bottoms
Commercial extremes are not symmetric. At bottoms they are sharp: hedges are lifted quickly once prices fall, the net snaps toward its range high, and the reversal tends to follow within weeks. At tops they are slow: hedging accumulates gradually as prices rise, the net can sit at its most-short extreme for months while the trend continues, and speculators keep paying up. In practice, a commercial index above 85 is a reasonably timely condition for looking for a long with the chart; a commercial index below 15 is a reason to stop adding to longs and to tighten management, not a reason to short. Gold in strong bull markets has printed record commercial shorts for a year at a stretch.
Worked reads
Gold. The commercial net is short 240,000 contracts, its three-year range −320,000 to −110,000, so a commercial index of about 38. The net reduced its short by 22,000 this week while price fell 3%. Read: hedges being lifted into weakness, index mid-range heading up. Not an extreme; a market that is cleaning out, not one that has cleaned out. Wait for the index above 75 with a daily structure turn before treating it as a bottom condition. The gold COT article gives the full group breakdown for this market.
Euro. Commercials net short 178,000, speculators net long 165,000 at the 92nd percentile. The commercial side here is mostly bank flow mirroring clients, so the better read is the speculative one: crowded. The commercial net adds nothing independent in currencies except confirmation, which is why currency COT analysis leans on the speculative line.
Three mistakes
- Following commercials as a signal. "Commercials are net short, so I'm short" has you short every bull market in gold's history. The net is structurally short; only its place in its range means anything.
- Reading the sign in currencies as a view. Bank hedging mirrors client flow. The speculative net is the informative line for forex.
- Ignoring swap dealers. In commodities, the legacy commercial line includes index-fund demand through swap dealers. Use the disaggregated report and read producers and merchants on their own when the two diverge.
Where it fits
Commercial positioning is a context layer, read weekly, that tells you how much hedging pressure sits on each side of the market and whether it is at a historical extreme. It belongs in the same pre-trade routine as the speculative net, the macro backdrop and the chart, and it earns its place at extremes: the bottoms it marks are among the cleanest in commodity trading. SMC Terminal's COT Positioning tab shows the commercial net, its weekly change and its index alongside the speculative line for each of the 17 markets it tracks, so the mirror is always visible.
Frequently asked
Are commercial traders the smart money?
They are the informed money about their own business, not about the market's next move. Their positions are right at turns because hedging responds to price, not because they forecast it.
Why are commercials always net short in gold?
Because the biggest hedgers are miners selling future production. The net's size varies with price; its sign rarely does. Read the index, not the sign.
Which report shows commercial traders?
The legacy COT report, under "Commercial", and the disaggregated report, which splits them into producer/merchant and swap dealer. Both are published by the CFTC every Friday for the previous Tuesday.
Everything on SMC Terminal is analysis and education, not a recommendation to buy or sell. Figures in the example are illustrative. Trading carries a substantial risk of loss. Manage your risk.