COT Net Positions: How to Interpret Commercial and Speculative Traders
The COT report's most useful number is the net position — longs minus shorts — for each trader group, and the most useful picture is the two groups moving as mirror images. This guide explains how net positions are built, what commercial and speculative nets each mean, the four states they can be in, and how to turn the weekly change into a bias.
Every Friday the CFTC publishes, for each futures market, how many contracts each group of traders held long and short on the previous Tuesday. The number traders actually use is the net position: longs minus shorts, per group. A positive net means the group is long on balance; a negative net, short. Two groups matter for forex and metals — the commercials (hedgers: producers, exporters, banks offsetting client flow) and the non-commercials or large speculators (funds and CTAs trading for profit). Their nets move as near mirror images, and reading that mirror correctly is most of COT analysis. This guide covers how the nets are built, what each group's net means, the four states a net can be in, and how to read the weekly change.
How a net position is built
| Group | Who | Net = long − short | What the net expresses |
|---|---|---|---|
| Commercial | Hedgers: producers, merchants, banks laying off client exposure | Usually the opposite sign to speculators | The hedging need of the real economy; they sell strength and buy weakness |
| Non-commercial (large speculators) | Hedge funds, CTAs, asset managers | The trend-following money | Where the profit-seeking crowd is positioned; extremes mark crowding |
| Non-reportable | Small traders below reporting thresholds | The remainder | Retail; noisy, rarely decisive |
Because every long contract has a short on the other side, the three nets sum to zero. When speculators add 20,000 net longs, commercials (and a little non-reportable) must have added 20,000 net shorts. That is the mirror, and it is why a chart of the two nets looks like a reflection. The COT report guide covers the report's columns; this article is about reading the nets once you have them.
The mirror, drawn
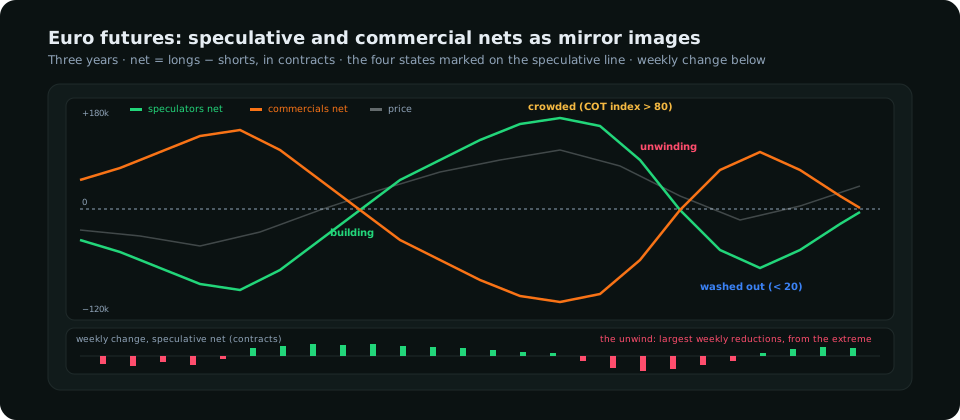
The mirror has a consequence many traders miss: the two nets carry the same information. "Commercials are heavily short the euro" and "speculators are heavily long the euro" are one fact. The reason to watch commercials separately is their behaviour at turns — hedgers are price-insensitive on the way in (they hedge because they must) but their net reaching a multi-year extreme has historically coincided with the speculative crowd being most exposed.
Four states a net can be in
| State | Speculative net | Weekly change | Read | Bias implication |
|---|---|---|---|---|
| Building | Rising from mid-range | Adding, steadily | A trend with room; the crowd is joining, not full | With the trend; pullbacks are buys |
| Crowded | Near the 3-year high (COT index > 80) | Small or flat | Everyone who wants to be long is long; little fuel left | Neutral to contrarian; tighten; watch for the first big reduction |
| Unwinding | Falling from an extreme | Large reductions | Forced selling; moves overshoot | Against the old trend until the net is mid-range |
| Washed out | Near the 3-year low (COT index < 20) | Small | Short covering ahead; little selling left | Contrarian long once price confirms a turn |
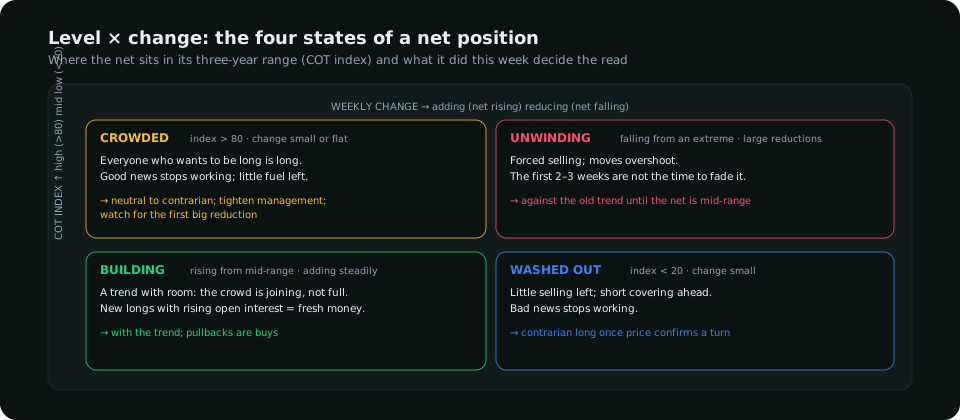
"Near the three-year high" is measured by the COT index, which rescales the net to 0–100 over a 156-week window so a reading means the same thing in euro futures and in gold. The absolute net in contracts is hard to interpret alone: 100,000 net long is crowded in the yen and ordinary in the euro.
Reading the weekly change
The level of the net says how crowded; the change says what the crowd did this week, and the two together are the read. Three patterns recur:
- Net rising, price rising — healthy trend; the crowd is being paid to join. Continue with the trend until the net is crowded.
- Net rising, price flat or falling — the crowd is buying into weakness; the market is absorbing them. One of the more reliable warnings of a sharp move against the crowd.
- Net falling sharply from an extreme, price falling — the unwind. These weeks produce the largest moves; the first two or three weeks of an unwind are not the time to fade it.
The size of a change is judged against the market's own history: a 15,000-contract move in the euro is routine, in the Swiss franc it is enormous. The weekly change column on SMC Terminal's COT Positioning tab shows the change in contracts and in percent of open interest for this reason.
Open interest as context
Net positions are counts of contracts, and the number of contracts in existence — open interest — changes. A net of 150,000 long when open interest is 700,000 is a very different exposure from the same net at 400,000. Two checks keep the nets honest: the net as a percentage of open interest (speculators above 35–40% of open interest in a currency future is historically crowded), and whether a change in net came with rising or falling open interest. New longs with rising open interest is fresh money; a rising net with falling open interest is shorts covering, which is weaker fuel. The forex COT article works through the currency-specific quirks, including why a dollar view has to be assembled from the other currencies' nets.
A worked euro read
Suppose this Friday's report shows euro futures speculators net long 165,000 contracts, up 12,000 on the week, with the three-year range from −115,000 to +190,000, so a COT index of about 92. Commercials are net short 178,000. Open interest rose 9,000. Price was up 0.8% on the week.
The read: crowded and still building. The net is in the top decile of its range, the crowd is adding on strength with new money (rising open interest), and price is confirming. That is late-trend behaviour: the bias stays bullish while price makes higher lows, but the position is one where the next large reduction in the net — a drop of 25,000 or more in a week — would be the signal that the unwind has begun. A trader long the euro tightens the management plan; a trader looking to join at these readings is buying the last leg. The extremes article has the history of what follows readings above 90.
What net positions cannot do
They cannot time a turn. Crowded markets stay crowded for months in strong trends, and the net can be at 95 for ten weeks while price keeps rising. They are a weekly, Tuesday-stamped snapshot released Friday, so they say nothing about this morning. And they describe futures, which for currencies are a fraction of the spot market — representative, not complete. Used as a bias filter and a crowding gauge, with price structure doing the timing, they are one of the few sources of information in forex that is not already in the chart.
Frequently asked
Is a positive net position bullish?
A positive speculative net means the crowd is long. Whether that is bullish depends on where the net sits in its range and what it did this week: building from mid-range is bullish; crowded and stalling is a warning.
Should I follow commercials or speculators?
Follow speculators while the net is building; watch commercials when the speculative net is at an extreme. The two nets are mirror images, so they are one signal read from two sides.
Where do I get net positions?
The CFTC publishes them free every Friday at 15:30 Eastern; SMC Terminal's COT Positioning tab shows nets, weekly changes and the COT index for 17 markets.
Everything on SMC Terminal is analysis and education, not a recommendation to buy or sell. Figures in the example are illustrative. Trading carries a substantial risk of loss. Manage your risk.