AUD/USD Forecast, 24 October 2026: Break of Structure at 0.7000, Speculators at a Record Short — Buy or Sell Next Week?
AUD/USD forecast for the week of 27 October 2026: the pair closed at 0.7038 after five up days that swept the 0.6895 double bottom and broke the daily structure above 0.7015. It now sits at short-term resistance at 0.7035–0.7045 with the daily supply zone at 0.7100–0.7140 above and daily demand at 0.6850–0.6900 below. SMC Terminal's reads: large speculators net short a three-year record 127,292 contracts (COT index 0) with commercials at their most long (index 99), valuation fair at 0.7000, seasonality neutral, the US 2-year yield down 22 basis points in a month. The squeeze case, the levels, and whether to buy or sell, below.
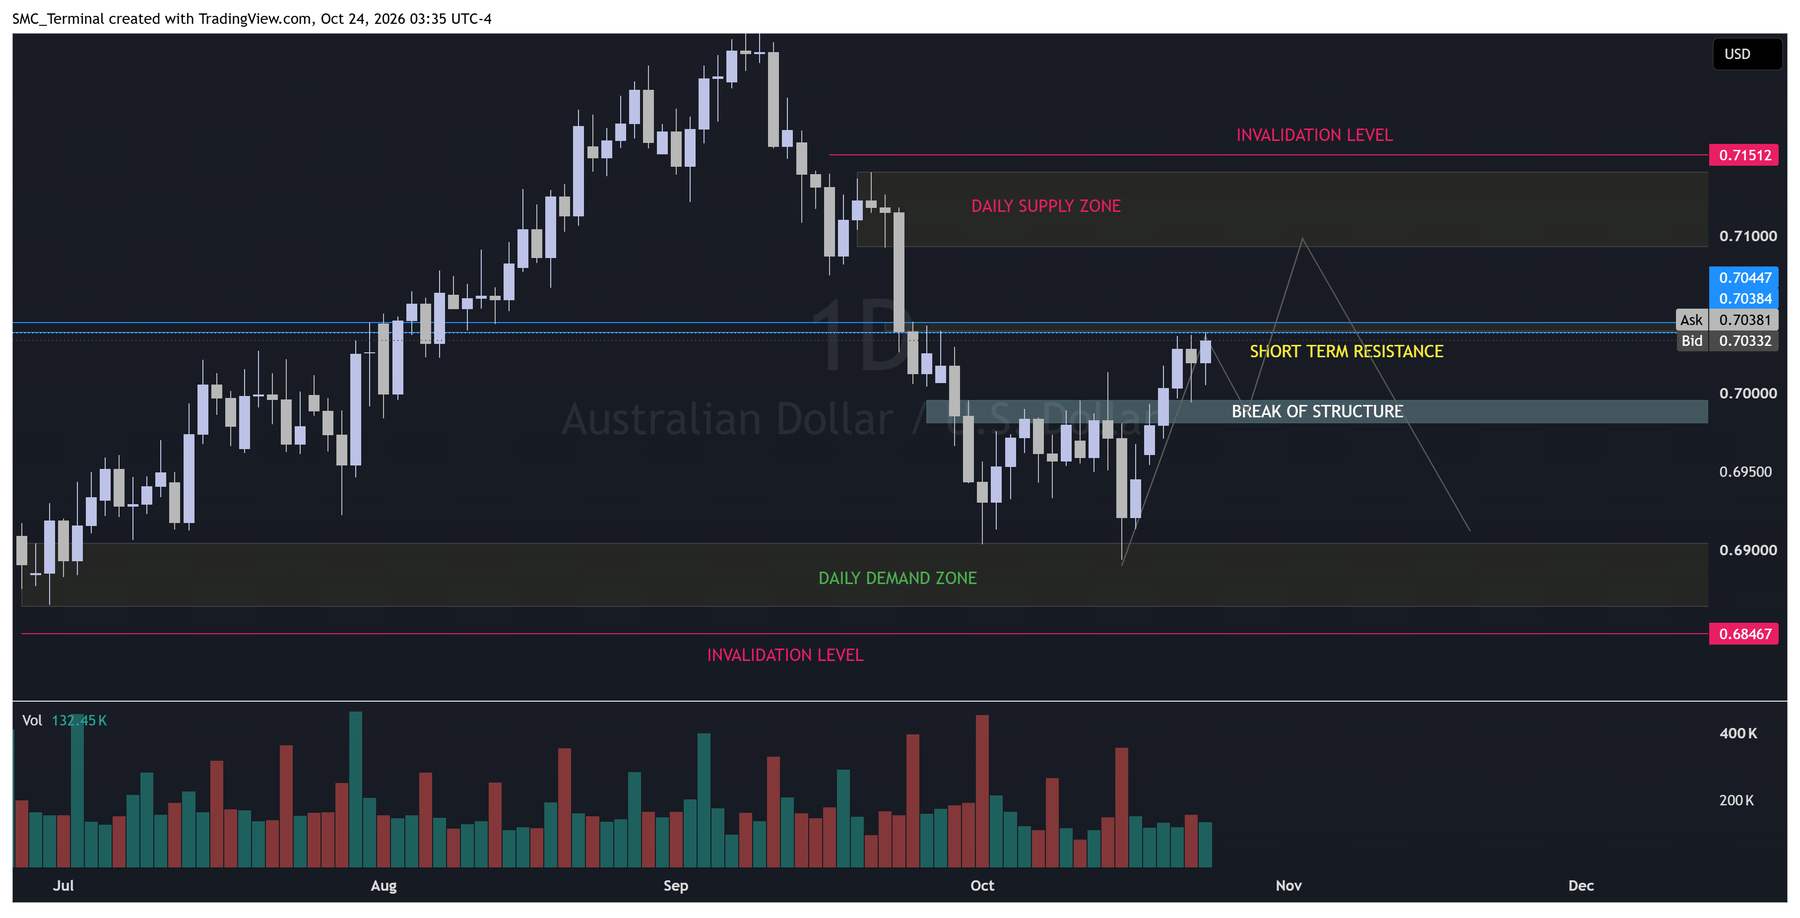
AUD/USD at the close of the week, Friday 23 October 2026: 0.7038. This AUD/USD forecast covers the daily chart, what SMC Terminal's positioning, valuation, seasonality and rates reads say about it, and the buy-or-sell question for the week of 27 October. The short version: the pair spent five weeks falling from 0.7239 to a double bottom at 0.6905–0.6895, and this week it swept that bottom, rallied five days in a row and closed above the last lower high at 0.7015. That is a daily break of structure, the first since August, and it arrives with large speculators holding their largest net short position in three years. Price is now pressing short-term resistance at 0.7035–0.7045; the daily supply zone at 0.7100–0.7140 is the target above, and the demand zone at 0.6850–0.6900 is where the idea is wrong below.
The daily chart
What the week did
| Day | Open | High | Low | Close | Read |
|---|---|---|---|---|---|
| Wed 14 Oct | 0.6984 | 0.6984 | 0.6895 | 0.6978 | Sweep of the 30 Sep low at 0.6905; long lower wick, close back inside |
| Thu 15 Oct | 0.6919 | 0.6970 | 0.6919 | 0.6919 | Retest of the sweep; holds above 0.6895 |
| Mon 19 Oct | 0.6982 | 0.7020 | 0.6972 | 0.6983 | First test of the 13 Oct lower high at 0.7015; rejected |
| Tue 20 Oct | 0.7007 | 0.7038 | 0.7007 | 0.7007 | Closes through 0.7000; the break-of-structure band |
| Wed 21 Oct | 0.7029 | 0.7038 | 0.6996 | 0.7029 | Daily close above 0.7015: the break of structure confirmed |
| Thu 22 Oct | 0.7019 | 0.7039 | 0.7006 | 0.7020 | Third test of 0.7038; no close above it |
| Fri 23 Oct | 0.7020 | 0.7045 | 0.7005 | 0.7038 | Fourth test; closes at the resistance, not through it |
The pair gained 0.9% on the week and 0.4% over twenty sessions. The sequence matters more than the size: a sweep of an obvious double bottom (14 October), a hold on the retest (15 October), and a daily close above the last lower high (21 October). That is the liquidity grab followed by the change of character that the smart money sequence looks for, and it played out on the daily chart over six sessions. What it has not yet done is clear 0.7045: four daily highs between 0.7038 and 0.7045 and four closes beneath them make that a short-term supply the market has to absorb before the supply zone above is in play.
Daily structure: the downtrend has changed character
| Swing | Date | Price | Label |
|---|---|---|---|
| High | 8 Sep | 0.7239 | The top |
| Low | 16 Sep | 0.7087 | L |
| High | 20 Sep | 0.7140 | LH |
| Low | 30 Sep | 0.6905 | LL |
| High | 13 Oct | 0.7015 | LH |
| Low | 14 Oct | 0.6895 | LL by 10 pips · a sweep of 0.6905 |
| Close above 0.7015 | 21 Oct | 0.7029 | Break of structure · change of character |
| Next lower high | 20 Sep | 0.7140 | The level that turns the daily trend up on a close above |
Read by swing points as in the trend analysis guide: the downtrend from 0.7239 is no longer intact, because the 13 October lower high has been closed above. It is not yet an uptrend either; that needs a higher low to form above 0.6895 and then a close above the 20 September lower high at 0.7140, which sits inside the supply zone. The chart is in the transition between the two, and the projected path on it (a rally into supply, then a return toward demand to build the higher low) is the textbook shape of that transition. The daily ATR is 48 pips, so the resistance band at 0.7035–0.7045 is a fifth of a day's range and the 0.6850–0.6900 demand zone is a full day.
The levels that matter
| Level | Price | What it is | How to use it |
|---|---|---|---|
| Short invalidation | 0.7151 | Above the supply zone and the mid-September highs | The bearish view (sell the supply) is wrong on a daily close above |
| Daily supply | 0.7100–0.7140 | The 20 September lower high and the origin of the late-September impulse down; tested once | The first target for longs; the zone to sell on a daily rejection while the trend is not yet up |
| Short-term resistance | 0.7035–0.7045 | Four daily highs this week, no close above | A daily close above it opens the supply zone; a rejection here is the pullback |
| Break-of-structure band | 0.6985–0.7015 | The 13 October lower high and the 0.7000 figure, now support | The pullback level for a long; a daily close back below it fails the break |
| Daily demand | 0.6850–0.6900 | The 30 September and 14 October lows; the swept double bottom | The last support; the long idea survives any wick into it but not a daily close below |
| Long invalidation | 0.6847 | Below the zone and the 14 October wick | The bullish view is wrong on a daily close below |
The zones are drawn wick to body as the support and resistance guide describes. The one that will decide next week is the smallest: 0.7035–0.7045. Four tests in four days have consumed some of its orders, which by the guide's own rule makes a fifth test more likely to break than to hold, and the positioning read below says what is behind that.
SMC Terminal's reads for the Australian dollar
Positioning: a record speculative short, and hedgers on the other side
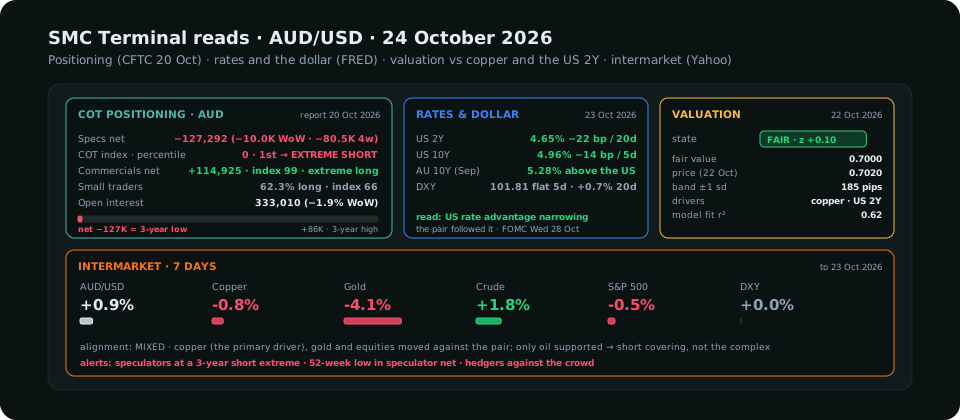
The CFTC report of Tuesday 20 October shows large speculators net short 127,292 Australian dollar futures, the largest net short in the terminal's three-year window and a 52-week low in the net. They added 9,993 shorts on the week and 80,478 over four weeks, which the Positioning tab labels "building shorts": the net went from −39K at the start of September to −127K now. On the three-year COT index the net sits at 0, the 1st percentile, extreme short. Commercials are the mirror: net long 114,925, index 99, their most long in three years, and the tab's "hedgers against the crowd" alert is firing. The commercial traders guide explains why that configuration, hedgers at one extreme and speculators at the other, has coincided with turns more reliably than any other positioning read. Two cautions, both real. Extremes persist: the extremes article shows crowded readings lasting for months, and an index of 0 says the crowd is full, not that it has started to leave. And this week's detail is mixed: open interest fell 6,454 while the net fell, so part of the move was long liquidation rather than new shorts, which the tab reads as a move nearer exhaustion than a fresh wave of selling. The read is that the fuel for a squeeze is as large as it gets; the chart, with this week's break of structure, has supplied the first spark.
Rates and the dollar: the US advantage is narrowing
The US 2-year yield fell from 4.87% to 4.65% over twenty sessions, 16 basis points of it on Thursday alone; the 10-year fell to 4.96%. The Australian 10-year was 5.28% at the last monthly reading (September), above the US for the first time in this cycle. The rate-differential logic says the pair trades the spread, and the spread has moved in the Australian dollar's favour by around 20 basis points in a month while the dollar index went nowhere (101.81, flat on the week, +0.7% over twenty days). The macro input is mildly bullish and, unlike gold this week, the pair followed it. The FOMC decision on Wednesday 28 October is the week's hinge for this read: a dovish confirmation extends the narrowing, a hawkish surprise reverses it in minutes.
Valuation: at fair
The terminal's model regresses AUD/USD on copper and the US 2-year yield over a two-year window (fit 0.62, the strongest of the reads). Fair value on 22 October was 0.7000 against a close of 0.7020: a z-score of +0.10, inside the band, narrowing. The pair is neither cheap nor stretched; valuation neither helps nor hinders the squeeze, and the upper edge of the fair band at 0.7185 sits above the short invalidation, so there is room on the model before the pair would read as rich.
Seasonality: neutral
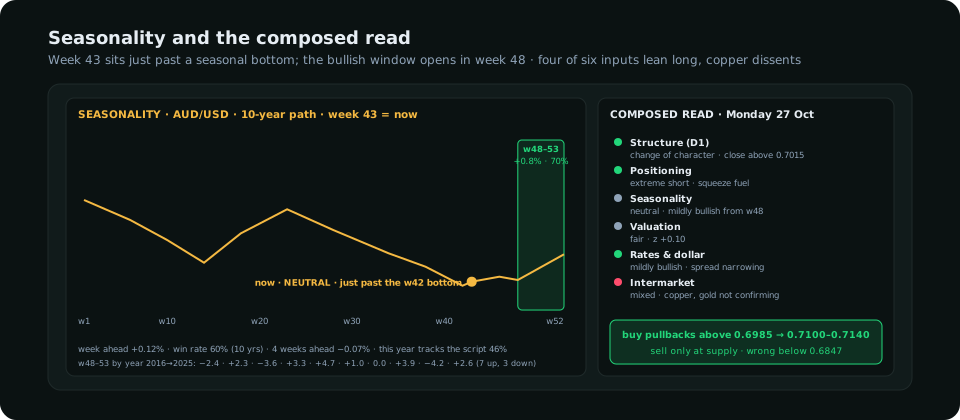
The Australian dollar's ten-year seasonal path puts a bottom at week 42 and the current week 43 in a neutral phase: the week ahead has averaged +0.12% with a 60% win rate, the four weeks ahead −0.07%. The next reliable move is the week-48-to-53 window (late November to year end), +0.77% on average with a 70% hit rate, seven years up and three down. This year's path has matched the seasonal script only 46% of the time, so seasonality is a light input for the pair; it does not oppose the long case and does not support it much either. The seasonality guide covers how to weight a read this weak.
Intermarket: the rally is not confirmed
Over seven sessions AUD/USD +0.9%, copper −0.8%, gold −4.1%, crude +1.8%, the S&P 500 −0.5%, the dollar unchanged. The terminal scores the alignment as "mixed": copper, the pair's primary driver, fell while the Aussie rose, gold fell hard, and equities slipped, so three of the four drivers that usually move with the pair moved against it. Only oil supported. Over thirty days the same picture: copper −3.0%, gold −7.2%, the pair +0.4%. That is consistent with the positioning read, not against it: the rally is being driven by short covering in the currency itself, not by the commodity complex, which is exactly what a squeeze looks like in its first week and exactly why it needs the chart to keep confirming rather than the drivers.
Buy or sell: the scenarios
| Scenario | Trigger | Entry area | Stop | Targets | Reward : risk |
|---|---|---|---|---|---|
| Buy the pullback (with the change of character) | A pullback into 0.6985–0.7015 that holds on a daily or H4 close, or an H4 close above 0.7045 after a sweep of the band | 0.6990–0.7015 | 0.6935 (below the band and the 15 Oct retest low); the full invalidation is 0.6847 | 0.7100 (lower edge of supply), then 0.7140 | About 1.9 to the first target from 0.7005 with a 70-pip stop; 2.4 to the second |
| Buy the break | A daily close above 0.7045 | 0.7045–0.7055 on the retest | 0.6995 | 0.7100, then 0.7140 | About 1.0 to the first target, 1.8 to the second; take only if the retest holds |
| Sell the supply (counter to the squeeze, with the old trend) | A daily rejection at 0.7100–0.7140 (a wick into it and a close back below 0.7100) | 0.7100–0.7130 | 0.7160 (above the short invalidation) | 0.7000, then 0.6900 | About 2 to the first target from 0.7120 with a 40-pip stop |
| No trade | Daily closes between 0.7000 and 0.7045 with no rejection and no break | The band neither breaks nor fails; wait for the close that decides it | |||
The pullback long is the best-priced trade and the best-aligned one: with the change of character, with a record short to squeeze, with the narrowing rate spread, and against nothing but copper. The break long is worse priced and taken only on a retest. The supply short is the projected path's second leg and a legitimate trade in its own right, because 0.7100–0.7140 is where the sellers of September are and where the daily trend has not yet been turned; it is a trade for a daily rejection, not for the first touch. The daily bias scorecard method applied to the pair for Monday reads: structure +1 (change of character), previous day +1, rates and dollar +2, positioning +1 (extreme short, squeeze fuel), calendar gate open: a total of +5, a long bias. The one caveat is that positioning scores +1 here as a condition for a squeeze, not as a timing signal; if the band at 0.7045 holds for a fifth day and the pair closes back below 0.7000, the score is re-done from the new close.
AUD/USD news for the week ahead
- Wednesday 28 October, FOMC: the decision and press conference at 18:00 UTC (23:00 Pakistan time, 22:00 Gulf). No new positions into it. The pair's rally rests on the US 2-year yield falling; a hawkish surprise would lift it and reverse the week's move through 0.7000 in an hour, a dovish confirmation would be the catalyst the squeeze needs to clear 0.7045.
- Australian CPI (quarterly), Wednesday morning Sydney time: the Reserve Bank's path depends on it; a hot print lifts Australian yields and the pair before the FOMC, a soft one does the reverse. Check the calendar for the exact time in your zone.
- Copper: the pair's primary driver fell 3% over the month and did not confirm the rally. A copper bounce would be the missing confirmation; a further copper fall is the warning that the squeeze is running on currency positioning alone.
- Friday's COT report (for Tuesday 27 October) will show whether the record short began to cover. A net rising from −127K by 15,000 or more would be the first evidence that the squeeze has begun in the futures market, not only on the chart.
AUD/USD live: the sessions that matter
The pair is most active from the Sydney open (22:00 UTC, 03:00 Pakistan time) through the Asian morning, when Australian data and Chinese data print, and again in the London–New York overlap from 12:30 to 16:00 UTC (17:30 to 21:00 Pakistan time) when the dollar's drivers release. The session guide covers which window each pair moves in; for AUD/USD the Asian session often sets the day's direction and New York extends or reverses it.
AUDUSD meaning, briefly
AUD/USD is the price of one Australian dollar in US dollars: 0.7038 means one Australian dollar buys 70.38 US cents. It rises when the Australian dollar strengthens or the US dollar weakens, and it is driven by the gap between Australian and US interest rates, by commodity prices (copper, iron ore, gold, which Australia exports), by China's demand for those commodities, and by global risk appetite. The beginners' guide covers how pairs are quoted; the reads above are the terminal's view of each of those drivers this week.
Frequently asked
Is AUD/USD a buy or sell today?
Markets are closed on Saturday; for Monday the bias is long on pullbacks into 0.6985–0.7015 toward 0.7100–0.7140, because the daily structure changed character this week and speculators hold a record short. It is not a buy at the first touch of 0.7045 resistance, and it is a sell only on a daily rejection at the supply zone.
What is the AUD/USD forecast for next week?
A test of the supply zone at 0.7100–0.7140 if 0.7045 breaks on a daily close, with the FOMC on Wednesday as the hinge. A daily close back below 0.7000 fails the break and returns the pair toward demand at 0.6850–0.6900.
Why is AUD/USD rising when copper is falling?
Because the rally is short covering in the currency: speculators are at a three-year record short and the chart gave them a reason to cover. Copper not confirming is a warning for the second week of the move, not the first.
What does a COT index of 0 mean for AUD/USD?
That large speculators are more net short than at any point in the last three years. It is a condition for a squeeze, not a timing signal: the crowd is full, and the chart decides when it starts to leave. This week's break of structure is the first sign that it has.
This is analysis and education, not a recommendation to buy or sell. Levels and reads are as of the 23 October 2026 close and will be updated in the next post. Trading carries a substantial risk of loss. Manage your risk.