Gold Analysis Today, 24 October 2026: XAU/USD Breaks $4,090 and Tests Daily Demand at $3,940 — Forecast for Monday and Next Week
Gold analysis for today, Saturday 24 October 2026: XAU/USD closed the week at $3,994 after a 4.1% fall that broke the October double bottom at $4,091–4,095 on the month's highest volume. Price now sits on the daily demand zone at $3,900–3,940 that held in July, inside a daily downtrend of lower highs from $4,755. The terminal's reads: speculators still net long and trimming (COT index 37), seasonality in its topping phase with a bearish week ahead, valuation only slightly above its real-yield and dollar fair value, and real yields falling. The plan for Monday and the week, including the FOMC on Wednesday, is below.
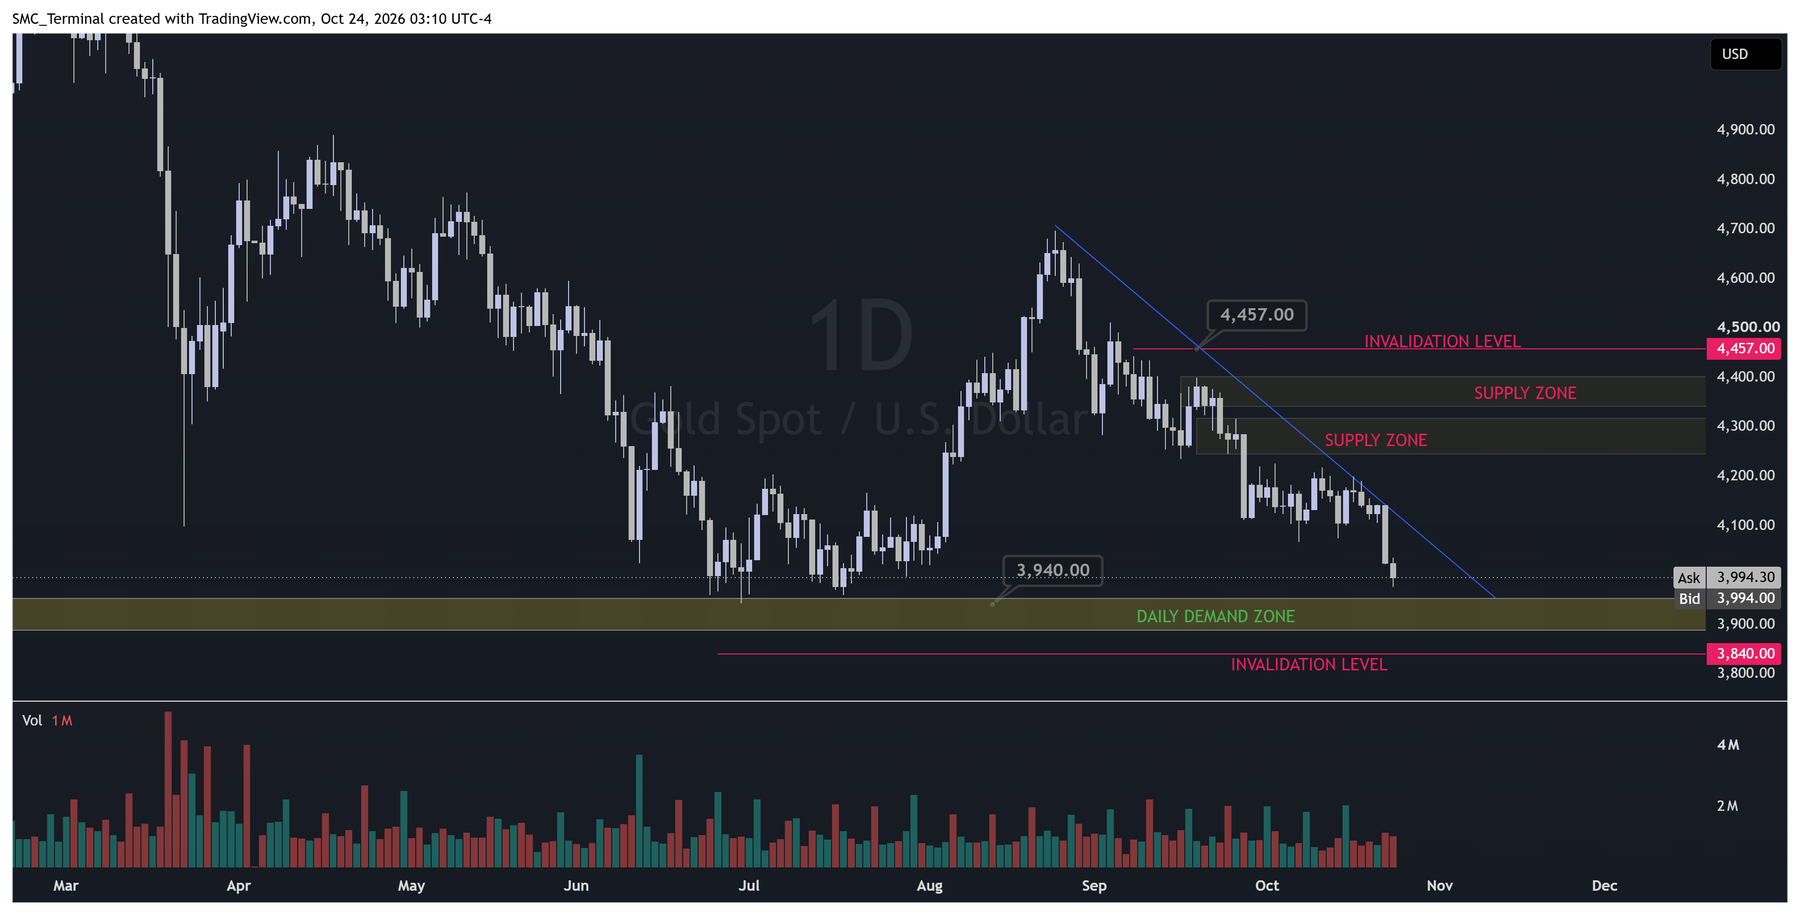
Gold (XAU/USD) at the close of the week, Friday 23 October 2026: $3,994 spot, $4,008 on the December future. This gold analysis for today covers what the week did, where price sits on the daily chart, what SMC Terminal's positioning, seasonality, valuation and rates reads say about it, and the plan for Monday and the week ahead. The short version: the daily trend is down and has been since the 25 August high at $4,755; this week's break of the October double bottom at $4,091–4,095 came on the highest daily volume of the month and took price straight into the daily demand zone at $3,900–3,940 that produced the July low. That zone is the level for Monday. Below it, the long idea is wrong at $3,840; above, the short idea is wrong at $4,457, with two supply zones and a descending trendline in between.
The daily chart
What the week did
| Day | Open | High | Low | Close | Read |
|---|---|---|---|---|---|
| Mon 19 Oct | 4,185 | 4,211 | 4,156 | 4,160 | Rejected under the 16 Oct lower high at $4,220 |
| Tue 20 Oct | 4,162 | 4,175 | 4,130 | 4,143 | Lower close; range midpoint lost |
| Wed 21 Oct | 4,143 | 4,161 | 4,122 | 4,150 | Inside day; a pause above the $4,091–4,095 lows |
| Thu 22 Oct | 4,159 | 4,164 | 4,037 | 4,060 | Displacement: a $127 range, close near the low, the month's highest volume (215K contracts) |
| Fri 23 Oct | 4,042 | 4,050 | 3,989 | 4,008 | Follow-through to the demand zone; no reclaim of $4,090 |
Futures prices, December contract. The week lost 4.1%; over the past twenty sessions gold is down 7.2% from $4,321. The important candle is Thursday's: the October lows at $4,091 (7 October) and $4,095 (14 October) were equal lows that every chart showed, which made them a stop cluster, and the question on Thursday morning was whether the push below them would be a liquidity grab or a breakout. The answer was in the close: a wide red body closing in the bottom quarter of its range, and Friday held below the level rather than reclaiming it. That is a breakout, and the broken double bottom at $4,090–4,095 is now the first resistance above price.
Daily structure: a downtrend, now at its first real support
| Swing | Date | Price | Label |
|---|---|---|---|
| High | 25 Aug | 4,755 | The top |
| Low | 2 Sep | 4,329 | L |
| High | 3 Sep | 4,559 | LH |
| Low | 16 Sep | 4,273 | LL |
| High | 18 Sep | 4,440 | LH |
| Low | 28 Sep | 4,143 | LL |
| High | 2 Oct | 4,259 | LH |
| Low | 7 Oct · 14 Oct | 4,091 · 4,095 | LL · equal lows |
| High | 16 Oct | 4,220 | LH |
| Low | 23 Oct | 3,989 | LL · in progress |
Read by swing points, as in the trend analysis guide: every high since August is lower than the last and every low is lower than the last. The downtrend is intact, and it ends only on a daily close above the last lower high at $4,220. The descending trendline from the August top sits near $4,150 on Monday and falls about $9 a day; it is the first thing a bounce meets. The daily ATR is $72, so the demand zone's $40 depth is a little over half a normal day's range, and a stop beyond it is a reasonable one.
The levels that matter
| Level | Price | What it is | How to use it |
|---|---|---|---|
| Short invalidation | 4,457 | The 18 September lower high region; above it the lower-high sequence is broken | The bearish view is wrong on a daily close above |
| Supply zone 1 | 4,320–4,400 | The origin of the late-September impulse down; tested once | Sell a rally into it on a daily rejection, if the trend is still down |
| Supply zone 2 | 4,250–4,300 | The early-October lower highs ($4,259, $4,242) | Nearer supply; the first serious cap on any bounce |
| Trendline | ≈ 4,150 Monday, falling | The descending line from $4,755 | Intraday resistance; a daily close above it is the first warning for shorts |
| Broken lows | 4,090–4,095 | The October double bottom, now resistance | The first target for a bounce and the first place a bounce should stall |
| Daily demand | 3,900–3,940 | The July lows; the last place buyers absorbed a decline of this size | The level for Monday; a daily rejection here is the long setup, a daily close below it is the short continuation |
| Long invalidation | 3,840 | Below the zone and the July wick | The bullish view is wrong on a daily close below |
The zones are drawn from wick to body as the support and resistance guide describes. The demand zone has one thing in its favour that the broken double bottom did not: it has been tested once (July) rather than twice, so the orders that produced it are less consumed. It has one thing against it: price is arriving after a four-day, $220 decline with momentum, not after a consolidation, which is the approach that more often produces a sweep than a bounce.
SMC Terminal's reads for gold
Positioning: trimming, not washed out
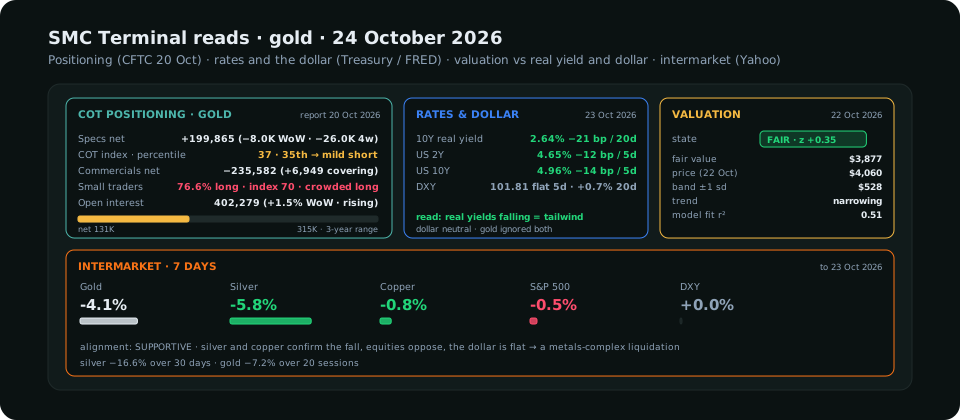
The CFTC report of Tuesday 20 October shows large speculators net long 199,865 contracts of COMEX gold, down 8,014 on the week and 25,988 over four weeks, which the Positioning tab labels "trimming longs". On the three-year COT index the net sits at 37, the 35th percentile: mild short territory, inside the normal range, with no alert. Two details matter for the week ahead. Speculators cut longs while open interest rose 5,934 contracts, which means fresh shorts were opened rather than longs simply leaving: sellers are initiating. And small traders are still 76.6% long with their own index at 70, crowded long; the retail-sized crowd has not capitulated. Commercials are net short 235,582 and covered 6,949, which is hedgers buying back into weakness, as they do. The commercial traders guide explains why that is a response to price rather than a view. The positioning read is that gold is not at a contrarian bottom: an index of 37 has room to fall to the teens before the "washed out" condition that has marked prior lows, and the speculative net of 200K is still well above the 52-week low of 154K. This fall has further to run in positioning terms before it is exhausted, which argues against buying the demand zone on size.
Rates and the dollar: the macro input is mildly bullish, and gold ignored it
The 10-year real yield closed Thursday at 2.64%, down 21 basis points over twenty sessions and 14 over five; the 2-year yield fell 16 basis points on Thursday alone to 4.65%; the dollar index is 101.81, flat on the week. By the real yields relationship, falling real yields with a flat dollar should have lifted gold, and instead gold fell 4%. That divergence is the week's most important macro fact. It says the selling was not rate-driven; it was positioning being unwound across the metals (silver fell 5.8% on the week and 16.6% over thirty days, copper 0.8%). Liquidation moves exhaust themselves on positioning, not on yields, which is why the COT read above matters more than the rates read this week. When the unwind ends, the rates backdrop is a tailwind waiting to be used, which is the argument for the demand zone eventually holding, even if not on the first touch.
Valuation: nearly fair
The terminal's gold model regresses price on the 10-year real yield and the dollar index over a two-year window (fit 0.51). Fair value on 22 October was $3,877 against a close of $4,060: a z-score of +0.35, inside the fair band, with the gap narrowing. The fall has done the work of bringing price back to what real yields and the dollar justify. Gold is not cheap here on this model, but it is no longer stretched, and the lower edge of the fair band sits well below the demand zone, so valuation offers no floor of its own.
Seasonality: a bearish week, then a bullish window
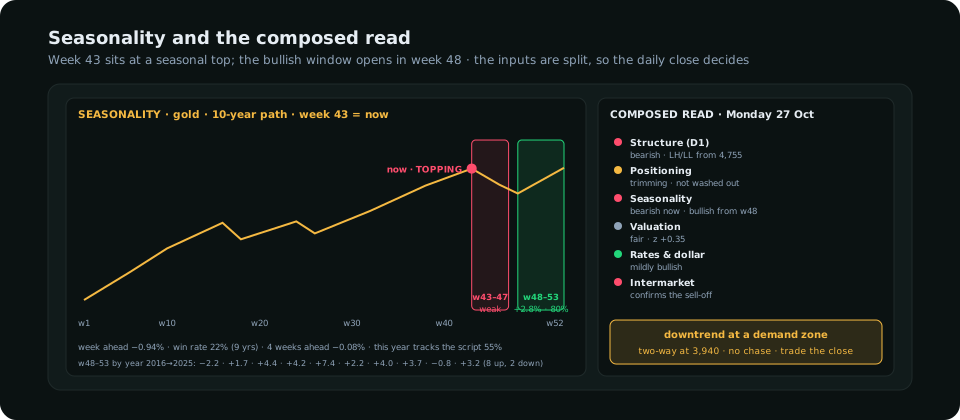
Gold's ten-year seasonal path puts week 43 (this week) at a seasonal top and the phase at topping. The week ahead has averaged −0.94% with a 22% win rate over the nine completed years with data, and the four weeks ahead −0.08%: historically the weakest stretch of the fourth quarter. The next reliable seasonal move is the week-48-to-53 window (late November through year end), which averaged +2.79% with an 80% hit rate over 2016–2025, eight years up and two down. Seasonality is one input and not a timing tool, as the seasonality guide argues, but this year's path has only matched the seasonal script 55% of the time; the read for the coming week is that it does not fight the downtrend.
Intermarket: the metals are selling together
Over seven sessions gold −4.1%, silver −5.8%, copper −0.8%, the S&P 500 −0.5%, the dollar unchanged. The terminal scores the move as "supportive": gold's own fall is confirmed by silver and copper, which rules out a gold-specific event and points to a complex-wide liquidation. Silver down 16.6% over thirty days is the clearest sign of that. The one opposing driver is equities, down slightly, which in a normal week would support gold as a haven; it did not, which is one more sign that positioning, not macro, drove the week.
Scenarios for Monday and the week
| Scenario | Trigger | Entry area | Stop | Targets | Reward : risk |
|---|---|---|---|---|---|
| Bounce from demand (counter-trend) | A sweep of $3,940 into the zone and a daily close back above $3,960, or an H4 close back above $3,990 after the sweep | 3,940–3,960 | 3,895 (below the zone's body; the full invalidation is 3,840) | 4,090 (broken lows), then the trendline near 4,150 | About 2.4 to the first target from 3,950 with a 55-dollar stop |
| Continuation lower (with the trend) | A daily close below $3,900, or a rally to $4,090–4,150 rejected on a daily close | 4,090–4,150 on the retest, or 3,890 on the break | 4,225 for the retest short (above the 16 Oct lower high); 3,960 for the break short | 3,900 then 3,840 for the retest short; 3,840 then 3,780 for the break short | About 2 to the first target on the retest; about 1.4 on the break, which is thin |
| No trade | Price chops between $3,950 and $4,060 without a close through either | The zone neither holds with a rejection nor breaks with a close; wait for the daily close that decides it | |||
The bounce is the better-priced trade and the worse-aligned one: it is against the daily trend, against seasonality and against positioning that is not yet washed out, so it is sized small and taken only on a rejection, never on the first touch. The continuation short is aligned with the trend but poorly priced at the zone; its better version is the retest of the broken lows at $4,090–4,150, which may come Monday or Tuesday if Asia bounces. The daily bias scorecard for Monday reads: structure −2, previous day −1, real yields and dollar +2, positioning 0, calendar gate open: a total of −1, which is a neutral score, and a neutral score allows only a half-size trade in the structure's direction after a sweep, or the bounce at half size. That is the honest state of the chart.
The week ahead
- Monday: the Asian session will define the first range around $3,990; the London open at 07:00 UTC (12:00 Pakistan time) usually sweeps one side of it. A sweep of the Asian low into $3,940 and a close back is the bounce setup; a sweep of the Asian high and rejection is the first short.
- Wednesday 28 October: the FOMC decision and press conference. No new positions into it; the first move after the statement is reversed more often than not. With the 2-year yield having fallen 16 basis points on Thursday, the market is pricing a softer path, and a hawkish surprise would lift real yields and extend gold's fall through $3,900; a dovish confirmation would be the catalyst the demand zone needs. The calendar guide sets out the before, during and after windows.
- Friday's COT report (for Tuesday 27 October) will show whether the speculative net dropped through 190K and whether open interest kept rising with it. A net falling below the 52-week low of 154K with the index in the teens would be the first "washed out" reading of this decline, and the condition under which the demand zone becomes a buy on size rather than a scalp.
- Seasonality: weak through week 47; the bullish window opens in the last week of November.
Gold analysis today for Pakistan and Gulf traders
The levels above are in US dollars per ounce on XAU/USD; the gold rate in Pakistan follows XAU/USD multiplied by the dollar-rupee rate, so a move from $3,994 to $3,940 is a 1.4% fall in the rupee price of gold before any currency effect. The sessions that matter for the plan fall at 12:00 Pakistan time (London open) and 17:30 (the US data and New York open); the FOMC statement on Wednesday lands at 23:00 Pakistan time. The gold day-trading guide has the full session map.
Frequently asked
Is gold predicted to go up or down?
On the daily chart the trend is down and stays down until a daily close above $4,220. For next week the structure, seasonality and positioning reads lean down; the rates read leans up. The most likely path is a test of $3,900–3,940 with a bounce attempt, and the decision is made by the daily close at that zone.
What is the analysis for gold today?
Gold closed the week at $3,994 after breaking the October double bottom at $4,090 on heavy volume. It sits on the daily demand zone at $3,900–3,940. The daily downtrend is intact; the demand zone is the first real support; the bounce is a small, counter-trend trade on a rejection and the continuation short is better taken on a retest of $4,090–4,150.
Is the gold rate expected to fall?
Positioning says the decline is not exhausted (COT index 37, small traders still crowded long), and seasonality says the coming week is historically weak. A daily close below $3,900 opens $3,840 and then $3,780. A daily close above $4,220 would end the downtrend and change the answer.
Is gold likely to go up or down today?
Markets are closed on Saturday; Monday's open is the next session. The first move is usually a sweep of the Asian range at the London open; the direction that holds after the first H4 close decides the day. Plan both sides at the levels above and trade the close, not the push.
This is analysis and education, not a recommendation to buy or sell. Levels and reads are as of the 23 October 2026 close and will be updated in the next post. Trading carries a substantial risk of loss. Manage your risk.