COT Index Explained: Positioning Extremes and Historical Context
The COT index turns a raw net position into a 0–100 score against its own history, which is what makes an 'extreme' comparable across markets and years. This guide explains how the index is built, why the lookback window changes the answer, what readings above 90 and below 10 have historically preceded, and how to use an extreme as context for a trade rather than as a trigger.
A net position on its own is a number without a ruler. "Speculators are net long 180,000 gold contracts" means nothing until you know whether 180,000 is a lot for gold, this year. The COT index is the ruler: it rescales any net position to a score between 0 and 100 against the range of the last N weeks, so that 95 means "more long than 95% of the lookback", in any market, in any year. The formula guide covers the arithmetic and the weekly workflow; this article is about what the extremes have actually meant, and how not to misuse them.
The index in one line
COT index = (current net − lowest net in the window) ÷ (highest net in the window − lowest net in the window) × 100.
At 100 the position is the most bullish of the window; at 0 the most bearish; at 50 the midpoint. Two choices shape every reading: which group's net (usually non-commercials or managed money — the speculators) and how long the window is.
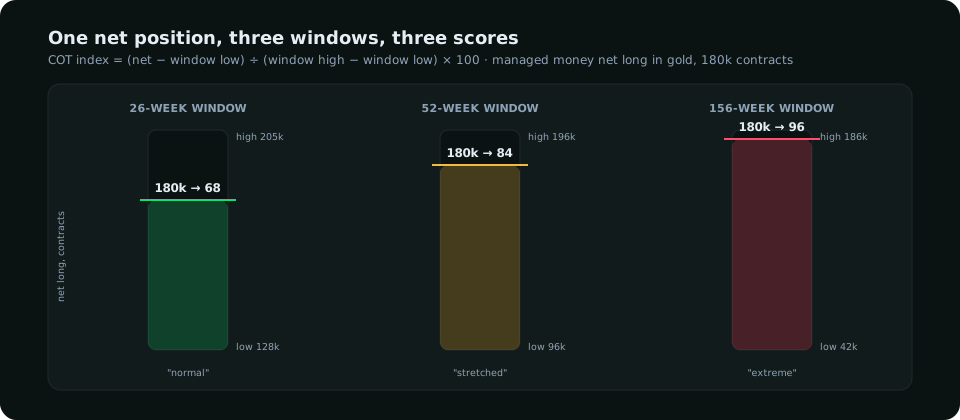
Why the window changes the answer
| Window | What an extreme means | Best for | Weakness |
|---|---|---|---|
| 26 weeks | Extreme for the last six months | Short-term swings; markets whose positioning turns fast (currencies) | Flags "extremes" constantly in a long trend |
| 52 weeks | Extreme for the year | The standard; a fair balance for most markets | Misses a multi-year build-up |
| 156 weeks | Extreme for three years | Gold, indices, bonds — markets that trend for years | Slow; can sit at 90+ for a long time in a secular move |
The practical rule: use 52 weeks for currencies and 156 weeks for gold, silver and the indices, and never compare a 26-week reading in one market with a 156-week reading in another. The terminal uses a 156-week window throughout, which is why its percentiles match each other across markets.
What the extremes have meant
Across the CFTC's history the pattern is consistent enough to state, and conditional enough to need care:
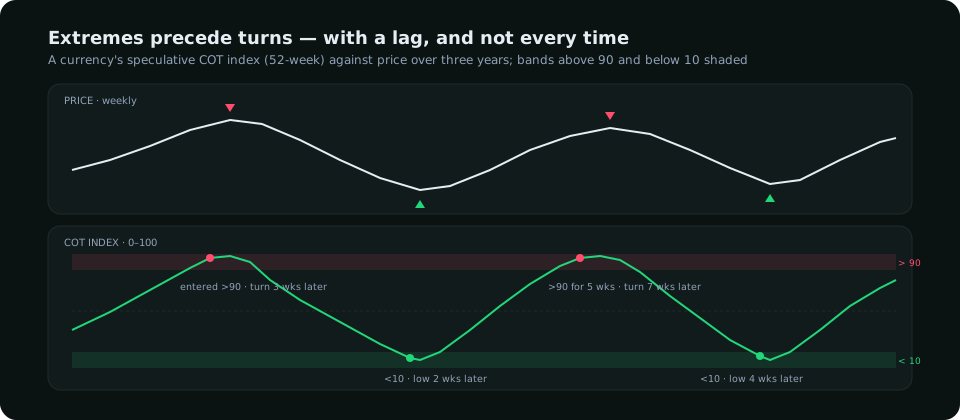
- Above 90 is a ceiling on upside, not a sell signal. When speculators are more long than at almost any point in the window, the marginal buyer is scarce. Rallies from there have tended to be shorter and to end in a sharp unwind when the first stops are hit. But a market can register 95 for ten consecutive weeks during a strong trend; shorting the first reading above 90 is one of the most expensive habits in positioning analysis.
- Below 10 is the better long context. A washed-out speculative position, with price holding a higher-timeframe support, has preceded many of the strongest rallies: the crowd is short and will have to buy.
- The lag is two to eight weeks. Between an extreme reading and the eventual turn there is typically a month or more, during which price often extends further. The extreme tells you to stop adding and to tighten; it does not tell you which week.
- Divergence between index and price is the sharper signal. Price making a new high while the index fails to — speculators adding less on each push — has preceded turns more reliably than the level alone.
Market by market
| Market | Group to use | Window | Note |
|---|---|---|---|
| EUR, GBP, JPY, AUD, CAD, CHF | Non-commercial (legacy) or leveraged funds (TFF) | 52 weeks | Yen extremes have been especially reliable before intervention-driven turns |
| Gold, silver | Managed money (disaggregated) | 156 weeks | Crowded longs persist through bull markets; use with real yields (gold COT guide) |
| S&P 500, Nasdaq | Asset managers and leveraged funds separately | 156 weeks | The two groups often oppose each other; read both |
| Crude oil | Managed money | 52 weeks | Producer hedging dominates the commercial side; ignore it for direction |
Using an extreme in a trade
The index is context, and it belongs in the step before the entry:
- Index above 90 + bullish structure: stay with the trend but take profit faster, add nothing, size the next entry smaller. The first 4-hour change of character is the cue to get flat.
- Index above 90 + bearish structure shift: the best short context the report produces — crowded longs with the first structural crack. Trade it with normal size.
- Index below 10 + support holding + an hourly shift up: the strongest long context. The crowd has to buy.
- Index 30–70: the report is not the story this week. Trade structure and the drivers.
Combine it with the other reads rather than letting it stand alone. A 92 on EUR with the dollar's rate differential still widening against the euro is a 92 that can stay 92 for a long time; a 92 with the differential turning is one to respect.
Mistakes
- Mixing windows across markets, or changing the window mid-analysis to make a reading look extreme.
- Reading commercials as a signal. In most markets the commercial net is the mirror image of the speculative net plus hedging; its index is the speculators' upside down, with no extra information.
- Treating 90 as a trigger. It is a condition. Wait for structure.
- Forgetting the date. Positions are as of Tuesday, published Friday; a big move between the two changes the picture.
Read with a fixed window, the right group and a structure trigger, the COT index is the clearest measure of "how much fuel is left" available to a retail trader. Read as a signal, it is a slow way to fight trends.
Everything on SMC Terminal is analysis and education, not a recommendation to buy or sell. Positioning statistics describe historical tendencies and are not predictions. Trading carries a substantial risk of loss. Manage your risk.