Recession Indicators Are Green. Job Quality Is Not: Claims at 189,000, Layoffs at 1.0%, Payrolls +165,000, and 339,000 More Involuntary Part-Timers
Every measure a recession model watches says the US labour market is fine: initial jobless claims fell to 189,000 in the week to 31 October 2026, matching the lowest reading since 1969; the JOLTS layoff rate was 1.0% in September, near the floor of its 25-year history; October payrolls rose 165,000 against a consensus near 65,000 and revisions added 84,000. Underneath, the number of people working part-time because they cannot find full-time hours rose by 339,000 to 4.8 million, the U-6 rate rose to 7.9%, and wages at 3.1% are growing slower than prices at 3.6%. This guide reads both sets of numbers, explains why they disagree, and sets out what the split means for the Fed and the dollar.
Written on 14 November 2026. Data are from the Department of Labor's weekly claims report, the BLS JOLTS release for September and the Employment Situation report for October.
If you only looked at the numbers a recession model watches, the US labour market in November 2026 would be one of the strongest on record. Initial jobless claims fell to 189,000 in the week ended 31 October, below the 196,000 expected and matching the mid-July reading that was the lowest since 1969. The Job Openings and Labor Turnover Survey put the September layoff rate at 1.0%, near the floor of its 25-year history, with 7.52 million openings and a quits rate back above 2% for the first time since June 2025. October payrolls rose 165,000 against a consensus near 65,000, revisions added 84,000 to August and September, and unemployment fell to 4.1%. Nobody is being fired, people are quitting again, and hiring beat every forecast. Then look at the numbers a household feels. The count of people working part-time because they cannot find full-time work rose by 339,000 in October to 4.8 million. The U-6 measure of underemployment rose from 7.6% to 7.9%. Average hourly earnings grew 3.1% over the year while the Fed's preferred inflation gauge rose 3.6%, so the typical pay cheque buys less than it did a year ago. Both pictures are true. This guide reads them side by side, explains why they diverge, and sets out what the divergence means for a Federal Reserve that is about to hike into it. The payrolls guide covers how to trade the release; this is what the releases said.
The two dashboards
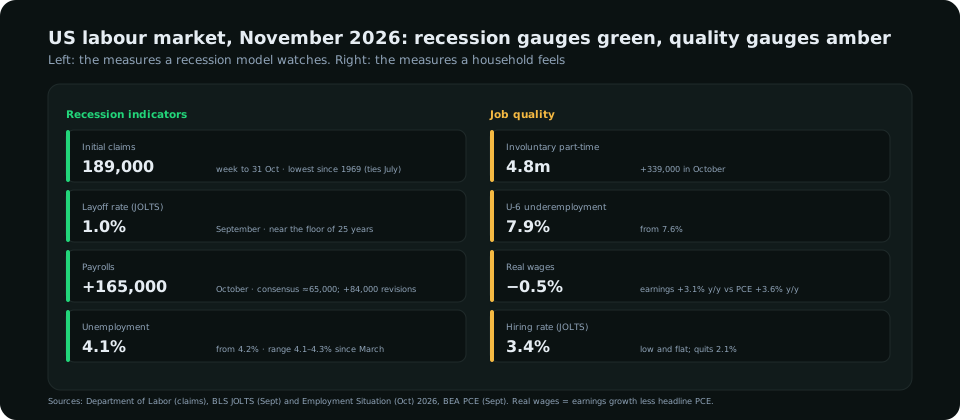
| Measure | Latest | Context | Colour |
|---|---|---|---|
| Initial jobless claims | 189,000 (week to 31 Oct) | Below 196,000 expected; ties the July low, the lowest since 1969; four-week average 194,750 | Green |
| Continuing claims | 1.718 million (week to 24 Oct) | Edging up; people who lose a job take a little longer to find the next | Green, fading |
| JOLTS layoffs and discharges | 1.0% (September) | About 1.6 million; near the bottom of the 25-year range | Green |
| JOLTS openings | 7.52 million, 4.5% | Trending up since June; higher than a year ago | Green |
| JOLTS quits | 2.1% (3.4 million) | First reading above 2% since June 2025; workers confident enough to leave | Green |
| Nonfarm payrolls | +165,000 (October) | Consensus ≈65,000; August and September revised up by 84,000 combined | Green |
| Unemployment rate | 4.1% | From 4.2%; inside the 4.1–4.3% range held since March | Green |
| JOLTS hires | 3.4% (5.4 million) | Low and flat: few layoffs, but not much hiring either | Amber |
| Part-time for economic reasons | 4.8 million, +339,000 | Slack work or unfavourable business conditions +356,000 to 3.25 million | Amber |
| U-6 underemployment | 7.9% | From 7.6%; the broadest measure of slack rose while the headline rate fell | Amber |
| Real wages | ≈ −0.5% | Earnings +3.1% y/y to $38.00; headline PCE +3.6% y/y | Amber |
Why the two sets disagree
- Low firing is not the same as strong hiring. Claims and the layoff rate measure separations. The hiring rate, at 3.4%, is low and has been low all year. A labour market where employers neither fire nor hire is stable, which keeps the recession gauges green, but it is also one where a worker who loses hours cannot easily replace them, which is what the part-time figure shows.
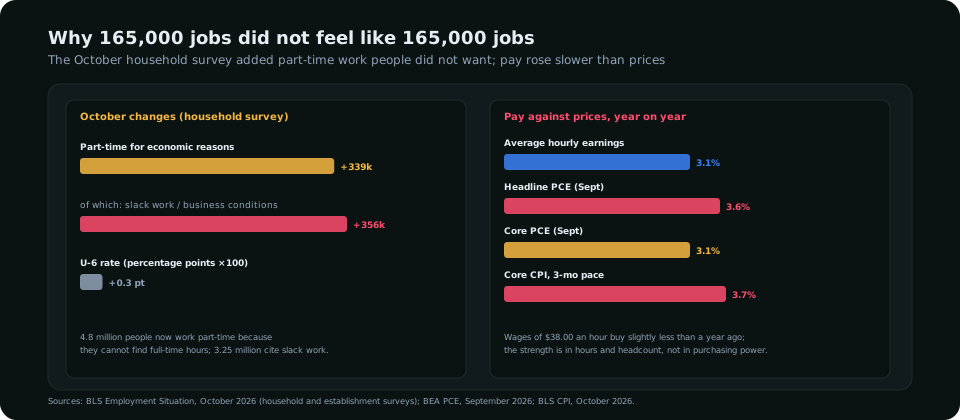
- Payrolls count jobs; the household survey counts people. The establishment survey produced the 165,000. The household survey, which produces the unemployment rate and the part-time figures, recorded a rise in people on reduced hours. A month in which both headcount and involuntary part-time work rise is a month in which employers added bodies but cut hours per body, the pattern of a business that wants flexibility rather than commitment.
- Where the jobs were. Professional and business services added 70,000, the most of any sector, with health care and transportation and warehousing behind. Temporary help rebounded. Those are real jobs; they are also the categories that expand first when employers are unsure and contract first when they decide.
- Wages were strong in nominal terms and weak in real ones. A 0.4% monthly rise and 3.1% annual growth in earnings would have been a solid print in 2019. Against 3.6% headline PCE inflation, driven by an energy shock the household cannot avoid, it is a pay cut. The CPI guide covers the price side.
What it means for the Fed
The Federal Reserve's mandate names employment and prices, and on the employment side the numbers it weighs most are the ones that are green. Chair Warsh called the employment picture "quite positive" on 28 October, before the payrolls report made it more so, and the Committee's statement upgraded growth to "strong". A central bank looking at claims at a 57-year low, layoffs at 1.0% and payrolls nearly three times consensus does not see a labour market that a quarter-point hike will break, and that is the permission slip for December. The statement guide covers how the Committee reached that view and the December odds guide how the market priced it. The amber column matters for what comes after. Rising involuntary part-time work and falling real wages are the early form of the slack that eventually shows up in the unemployment rate; one month does not make a trend, as the Forbes analysis of the report noted, but it is the direction a tightening cycle produces, and the Fed's own forecasts in December will have to say whether it expects more of it. The GDP guide makes the related point that consumer spending grew faster than real incomes in the third quarter, which is a drawdown of savings, not a sign of strength.
What it means for the dollar and yields
| Market | Read |
|---|---|
| US dollar | Supported. Strong headline employment with a hiking Fed is the configuration behind the dollar index's rise to about 103.4, its highest since April 2025; the amber column is not yet in the price |
| 2-year Treasury | 4.87% on 13 November; payrolls on 6 November were the release that put December back toward 80% after the late-October dip |
| 10-year Treasury | 5.15%; strong nominal growth plus elevated inflation keeps the long end bid for yield, not for safety |
| Gold | Negative: a labour market that permits hikes is the opposite of what gold needs; one-year low on 12 November |
| Equities | Split by sector: cyclicals like the headcount, long-duration growth dislikes the rate that follows |
What to watch
- Weekly claims. The 189,000 print was for the week to 31 October; the series is released every Thursday and a move back above 210,000 would be the first sign the green column is changing. Continuing claims at 1.718 million are the better early warning, because they measure how long it takes to find the next job.
- November payrolls on 4 December. Five days before the FOMC. The consensus will be built on October's surprise, so the bar is higher; the household survey's part-time figures are the line to read second.
- October JOLTS, early December. Whether the quits rate held above 2% and whether hires finally rose. A labour market with 7.5 million openings and a 3.4% hiring rate is one where employers advertise more than they hire.
- Real wages. If November's earnings growth stays near 3% while headline inflation stays near 3.6%, the consumer that carried the third quarter is spending savings, and savings run out. The fundamentals guide covers why growth that outruns income is the kind that reverses.
What to read in the terminal
The Macro Economics module carries both columns: the labour inputs it uses for the US regime include claims, payrolls and unemployment alongside the U-6 rate and real earnings, so a month in which the headline improves while the quality measures deteriorate shows up as a regime that is "expansion" with a flagged "late-cycle" marker rather than as an unambiguous green. The red-events panel lists each Thursday's claims, the 4 December payrolls and the December JOLTS with consensus beside them; the feature tour shows the module, and it is part of every plan on the pricing page.
Frequently asked
What were initial jobless claims for the week ended 31 October 2026?
189,000, below the 196,000 expected and matching the mid-July 2026 reading that was the lowest since 1969. The prior week was revised to 195,000, the four-week average fell to 194,750, and continuing claims rose to 1.718 million.
What did the September JOLTS report show?
Job openings of 7.52 million (a 4.5% rate), hires of about 5.4 million (3.4%), quits of 3.4 million (2.1%, the first reading above 2% since June 2025) and a layoffs and discharges rate of 1.0%, about 1.6 million, near the floor of the survey's 25-year history.
Why is job quality weakening if payrolls are strong?
Because the headline counts jobs while the quality measures count hours and pay. In October the number of people working part-time for economic reasons rose by 339,000 to 4.8 million, U-6 underemployment rose to 7.9% from 7.6%, and average hourly earnings grew 3.1% over the year against 3.6% inflation, so real pay fell even as headcount rose.
What does the labour market mean for the December Fed decision?
The green indicators give the Fed room to raise rates on 9 December without fearing it will break employment; a quarter-point increase is fully priced. The amber indicators matter for 2027: they are the early form of the slack that a tightening cycle eventually produces, and the December projections will show whether the Committee expects more of it.
Everything on SMC Terminal is analysis and education, not a recommendation to buy or sell. Figures are from the Department of Labor, the BLS and the BEA as published through 13 November 2026. Trading carries a substantial risk of loss. Manage your risk.