DXY and Gold Correlation: Why the Relationship Sometimes Breaks
Gold is priced in dollars, so a stronger dollar should mean cheaper gold — and most of the time it does. But the DXY and gold correlation has flipped positive for months at a time, and traders who treat it as a law get hurt. This research piece measures the relationship, explains the three forces behind it, and shows how to tell in advance when it is about to break.
Ask a room of traders what drives gold and the first answer is the dollar: gold is priced in dollars, so when the dollar strengthens an ounce costs more in every other currency, demand softens, and the price falls. The relationship is real. It is also weaker, less stable and more conditional than the way it is usually taught, and the periods when it breaks are precisely the periods when it matters most. This article treats the DXY–gold correlation as a research question: how strong is it, what is actually behind it, and when should you stop trusting it.
How strong the correlation really is
Measured on weekly returns over the long run, the correlation between the US Dollar Index and gold is negative but modest — in the region of −0.3 to −0.5 depending on the window. That is a meaningful tendency, not a law. The more revealing number is the rolling correlation: compute it over a moving 26-week window and the line swings between roughly −0.8 and +0.5.
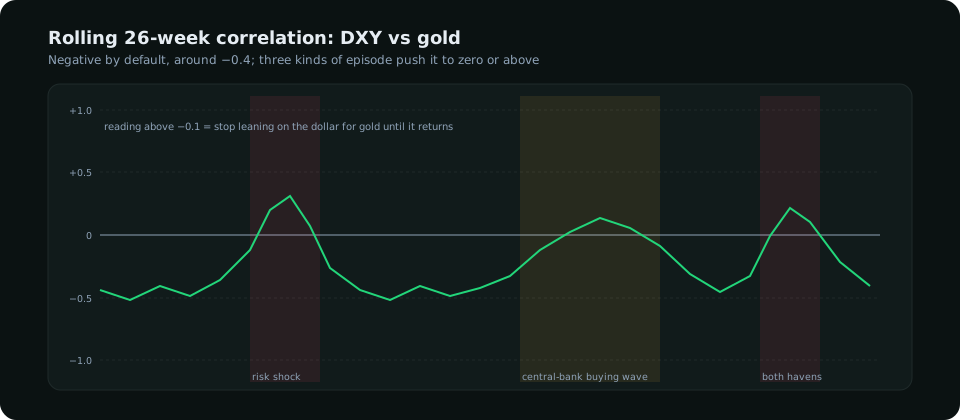
So the honest statement is: the inverse relationship is the default, it is moderate, and it is suspended for months at a time by forces that are stronger than the currency-translation effect. Knowing those forces is the whole skill.
The three forces behind the relationship
| Force | Direction for gold | Direction for DXY | Net effect on the correlation |
|---|---|---|---|
| Currency translation (gold priced in USD) | Down when USD rises | — | Negative — the textbook link |
| Real yields (nominal yield − expected inflation) | Down when real yields rise | Up when US real yields rise relative to others | Negative — and usually the stronger driver |
| Safe-haven demand in a risk shock | Up | Up (dollar funding demand) | Positive — both rise together |
| Central-bank and official-sector buying | Up, regardless of the dollar | Neutral to down over time | Weakens the link; gold rises through a firm dollar |
| Inflation surprise with the Fed behind the curve | Up | Mixed | Weakens or flips the link |
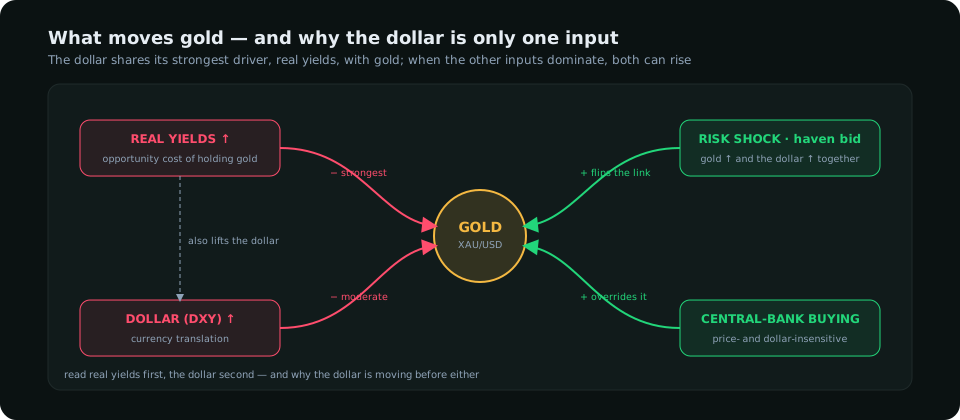
The most important row is the second. Real yields are a better single driver of gold than the dollar. Gold pays nothing, so the opportunity cost of holding it is the real return available elsewhere; when 10-year inflation-protected Treasury yields rise, gold tends to fall whatever the dollar does. The dollar and real yields are themselves correlated — higher US real yields attract capital and lift the dollar — which is why the DXY–gold link looks tighter than it is. Much of it is borrowed from the real-yield relationship.
When the relationship has broken
Three patterns recur:
- Risk shocks. In a sharp global selloff, the dollar rises because the world is short dollars and needs them, and gold rises because it is the asset nobody can print. The spring of 2020 and the autumn of 2008's recovery phase are the classic examples; the correlation went to zero or positive for weeks while both rallied.
- Official-sector buying. From 2022 onward, central banks — China, Poland, Turkey, India and others — bought gold at a pace not seen since the 1960s. That demand is price-insensitive and dollar-insensitive, and through much of 2023–24 gold set records while DXY held above 100. Traders who shorted gold "because the dollar is strong" fought a buyer who did not care.
- Stagflation fears. When inflation surprises upward and the market doubts the central bank will respond, gold rises on the inflation hedge while the dollar holds on yield. The 1970s is the long version; 2021's second half is the short one.
How to know in advance
You cannot forecast the correlation, but you can read whether the conditions for it are present. A checklist used before leaning on the dollar for a gold view:
| Check | Inverse link is reliable when… | Suspect it when… |
|---|---|---|
| Real yields and DXY | Moving the same way (both up or both down) | Diverging — e.g. the dollar up on risk while real yields fall |
| Equity volatility | Normal | Spiking — a risk shock lifts both |
| Official-sector purchases (World Gold Council quarterly data) | Average | Running at multi-year highs |
| Rolling 26-week correlation | Below −0.3 | Above −0.1 — the regime has already changed |
| Why the dollar is moving | Rates (Fed expectations, yield differentials) | Flight to safety or a crisis in another currency |
The last row deserves emphasis. A dollar rising on rates is bearish for gold; a dollar rising on fear is not. DXY cannot tell you which it is; the move in real yields and in equity volatility can. The DXY guide covers what the index itself measures — and the fact that it is 58% euro, which matters when the "dollar move" is really a euro move.
Using the relationship in a trade
- As confirmation, not as the thesis. A bearish gold structure with the dollar breaking out on rising real yields is a setup with two independent reads agreeing. A bearish gold structure with the dollar rising on a risk shock has one read and a contradiction.
- Through the intermarket lens. The cleanest way to use it is a table of gold's drivers — real yields, DXY, equity risk, positioning — updated daily, with each marked as supporting or opposing. The intermarket read on a research dashboard does this mechanically; a spreadsheet with the 10-year TIPS yield, DXY and the VIX does it manually.
- With the correlation itself as the regime signal. When the rolling correlation has risen to zero, stop using the dollar for gold until it falls back. The relationship will return — it always has — but you do not want to be the trader insisting on it while it is absent.
Summary
The DXY–gold correlation is negative, moderate and conditional. It is mostly a shadow of the real-yield relationship, it breaks during risk shocks and central-bank buying waves, and it is at its most dangerous when quoted as a rule. Read real yields first, the dollar second, and the reason the dollar is moving before either.
Everything on SMC Terminal is analysis and education, not a recommendation to buy or sell. Correlation figures are illustrative ranges, not precise statistics. Trading carries a substantial risk of loss. Manage your risk.