How to Analyse Gold Using the Commitment of Traders Report
The COT report for gold shows, every week, how heavily hedge funds, swap dealers and producers are positioned in COMEX gold futures. This practical guide shows which report to open, which columns matter for gold, how to turn a raw net position into a percentile, and how to read an extreme without mistaking it for a signal.
Every Friday afternoon the Commodity Futures Trading Commission publishes a count of who holds what in every US futures market as of the previous Tuesday. For gold that count is the closest thing retail traders have to seeing the order book of the people who move the metal: the hedge funds, the bullion banks and the miners. The general COT guide covers the mechanics; this one is specifically about analysing gold with it — which report, which columns, how to build a percentile, and what the extremes have historically meant.
Which report and which contract
Gold trades on COMEX, part of CME Group, under the contract "GOLD – COMMODITY EXCHANGE INC." (CFTC code 088691). Two versions of the report cover it:
| Report | Groups | Use for gold |
|---|---|---|
| Legacy | Commercial · Non-commercial · Non-reportable | Fine for a quick net-speculative read; the long history goes back to 1986 |
| Disaggregated | Producer/Merchant · Swap Dealer · Managed Money · Other Reportables · Non-reportable | Better — it separates the hedge funds from the banks, which in gold behave very differently |
Use the Disaggregated report, Futures and Options Combined, so that option positions converted to futures-equivalents are included; in gold they are large.
Who the groups are in gold
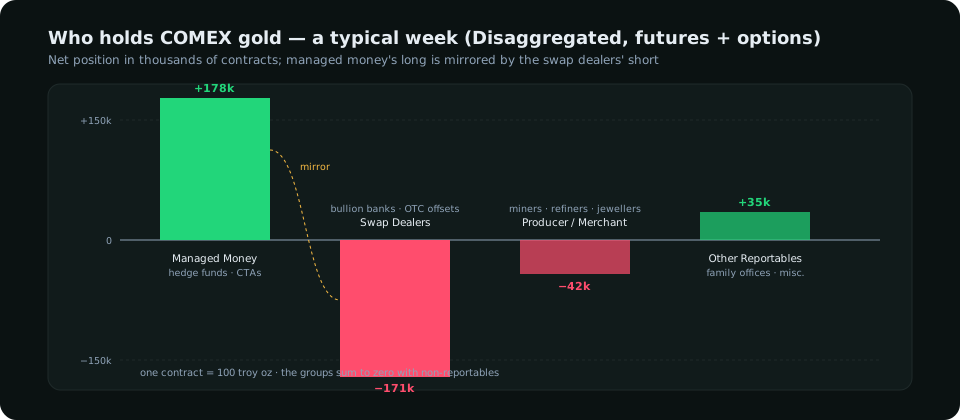
- Managed Money — hedge funds and CTAs. This is the speculative group, and the one whose positioning drives the medium-term swings. Their net position is the number most gold analysis is built on.
- Swap Dealers — the bullion banks, offsetting positions taken on by clients in the over-the-counter market. In gold they sit on the other side of managed money so consistently that their net short is almost a mirror image of the funds' net long.
- Producer/Merchant — miners hedging future production and refiners and jewellers hedging inventory. Net short by nature; changes are slow and rarely the story.
- Other Reportables — large traders who fit none of the above, including some family offices. Small, occasionally informative at extremes.
Step one: the net position
For each group, net = long contracts − short contracts. A COMEX gold contract is 100 troy ounces, so a managed-money net long of 180,000 contracts is 18 million ounces — the scale is why these numbers matter. Build the weekly series of managed money net and plot it. The level on its own tells you little; the change and the position within history are what carry information.
Step two: the percentile
A net long of 150,000 contracts was extreme in 2016 and ordinary in 2024, because the market grew. The fix is to express the current net as a percentile of its own history over a fixed window — the last 52 weeks or the last 156 (three years) are both common.
| Step | Calculation |
|---|---|
| 1 | Take the last 156 weekly values of managed money net. |
| 2 | Count how many are below this week's value. |
| 3 | Percentile = that count ÷ 156 × 100. |
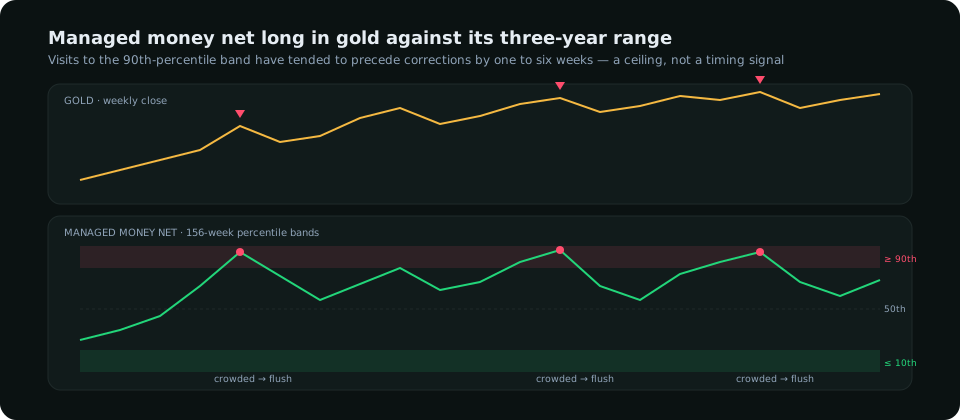
A reading in the top decile (90th percentile or above) means speculators are more long than in 90% of the last three years. That is the definition of "crowded" used in most positioning work, and the COT index is the same idea scaled 0–100 against the window's maximum and minimum.
Step three: what the extremes have meant
Three observations hold up across gold's history, with the usual caveat that none is a timing signal:
- A crowded long is a ceiling on upside, not a sell signal. When managed money is above the 90th percentile, the funds who would buy the next breakout are already in. Rallies from there have tended to be shorter and to end in a sharp flush when the first wave of stops is hit. Gold has also stayed above the 90th percentile for months during the strongest bull phases — shorting the first extreme is a well-known way to lose.
- A washed-out long is the better buy context. Managed money below the 20th percentile, with price holding a higher-timeframe support, has preceded many of the strongest rallies: the fuel is in the hands of the sellers, and a structure shift upward has a crowd to chase it.
- The change matters as much as the level. A 30,000-contract increase in net long in one week is a large injection of speculative demand; if price failed to make a new high on it, the market absorbed the buying — a bearish divergence that has preceded turns repeatedly.
Step four: combine it with the chart
The report is dated — Tuesday's positions, published Friday — and it says nothing about the next five days. It gets its value from being read next to price structure:
| COT read | Structure | Interpretation |
|---|---|---|
| Net long above the 90th percentile | Daily uptrend, 4-hour CHoCH down | The best bearish setup the report produces — crowded longs plus the first structural crack |
| Net long above the 90th percentile | Daily uptrend, structure intact | Stay long but take profit faster; do not add; size the next entry smaller |
| Net long below the 20th percentile | Daily support holding, hourly sweep and shift up | Strongest long context; the crowd is short and will have to buy |
| Net position mid-range | Anything | The report is not the story this week; trade structure and the drivers |
The gold structure guide covers the chart side; the point of combining them is that positioning tells you how much fuel a move has, and structure tells you whether it has started.
Three mistakes specific to gold
- Reading the commercials as "smart money" and fading the funds. In gold the commercials are hedgers with a structural short; their net short grows mechanically as the funds buy. It is not a bearish opinion.
- Ignoring the swap dealers. Because they mirror managed money, a sudden shrinking of the swap-dealer short without a matching change in the funds often means OTC flows — central-bank or physical demand — that the funds have not yet reacted to.
- Using the Tuesday snapshot on a Friday after a big move. If gold fell $120 between Tuesday and Friday, much of the recorded net long is already gone. Read the report against the Tuesday price, not the Friday one.
Where to get it and how to keep it current
The CFTC publishes the reports free at cftc.gov every Friday at 15:30 Eastern, with a full historical archive by year. Many traders keep a spreadsheet with the weekly managed-money net and the percentile formula; some charting platforms and dashboards — this one included — pull the report automatically and show the percentile beside the chart, which removes the Friday chore. Whichever way you do it, keep the window fixed and the group consistent, or the percentiles stop meaning the same thing from month to month.
Everything on SMC Terminal is analysis and education, not a recommendation to buy or sell. Positioning statistics describe historical tendencies and are not predictions. Trading carries a substantial risk of loss. Manage your risk.