Oil Price Shock October 2026: Brent at $117 and What It Means for Forex
Brent crude closed at $116.72 on 23 October 2026, its highest in six months, after Houthi strikes on Saudi energy sites and reports of renewed US action against Iran after the 3 November midterms. The oil price is now the single biggest driver of forex: it feeds inflation, lifts Treasury yields toward 5%, keeps a December Fed hike priced, and sorts currencies into exporters and importers. This guide explains the transmission, which pairs move and which way, and how to trade a market where the catalyst is a headline rather than a data release.
Written on 27 October 2026. Oil levels are from the 23 October close and the 27 October session; they will have moved.
The oil price shock of October 2026 is the story underneath every other story in forex this week. Brent closed at $116.72 on Friday 23 October, up 6.6% on the week and its highest close in six months; WTI settled near $103. On Monday and Tuesday it slipped back below $115 as talks in Tehran between Iran, Saudi Arabia, Pakistan and Turkey eased the fear of a wider conflict, and the market treated a 2% fall as relief. That is where the oil market is: a $115 barrel counts as calm. For currency traders the price matters less than the transmission. Oil at this level feeds inflation, which keeps Treasury yields near 5% and a December Fed hike priced, which supports the dollar, which pressures gold and the yen, and underneath all of that it sorts currencies into exporters and importers. This guide sets out the chain, which pairs move and in which direction, and how to trade a market whose catalyst is a headline that can arrive at any hour.
What happened
| Date | Event | Why it matters |
|---|---|---|
| 15 September | A Houthi drone attack shut Saudi Arabia's East-West pipeline; Aramco suspended loadings at Yanbu and cancelled late-September cargoes | Yanbu is the Red Sea outlet that lets Saudi exports bypass the Strait of Hormuz; it is the route the market was relying on |
| 23 October | Brent closed at $116.72, highest in six months; gold fell below $4,000 the same day | Oil-driven inflation fear raised Fed hike odds and yields, and gold paid for it |
| 24 October | Houthis claimed strikes on Yanbu, the Rabigh refinery and Riyadh's airport; the Saudi-led coalition said it intercepted two missiles | No confirmed loss of production, but the threat to the bypass route is repeated |
| 27 October | Talks in Tehran between Iran, Saudi Arabia, Pakistan and Turkey; Brent slipped below $115 | Diplomacy is the main downside risk to oil, and therefore the main upside risk to the yen and gold |
| 3 November | US midterm elections; reports of possible US-Israeli strikes on Iran afterwards | The date the market has marked as the next escalation window |
Bank of America's commodity strategist has said $120 is "probably on the cards" on average for the coming months if attacks on regional infrastructure resume, and the IEA's head has said energy markets will not return to pre-war conditions. The market is not pricing a return to $80; it is pricing the range $108–122 with the risk skewed up.
How oil reaches the currency market
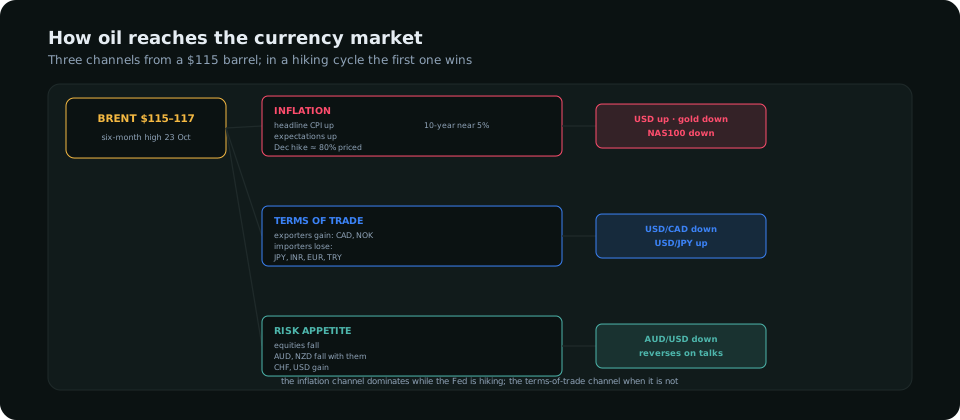
The inflation channel. Energy is the fastest-moving part of any CPI basket. A sustained move from $90 to $115 adds roughly half a point to headline inflation within two months, and the market does not wait for the print: inflation expectations and Treasury yields reprice on the day. With US CPI reported at 3.7% and the Fed already one hike into a tightening cycle, the oil move has kept December live and the ten-year near 5%. The Fed decision guide covers where that leaves Wednesday's meeting. In this channel oil is dollar-positive, gold-negative and yen-negative, because the dollar's rate advantage widens.
The terms-of-trade channel. Exporters earn more; importers pay more. The Canadian dollar and the Norwegian krone are the cleanest beneficiaries among liquid currencies: USD/CAD fell from a 2026 high of 1.4300 on 14 October to about 1.4060 as oil rose, even with the dollar firm elsewhere. Japan imports nearly all its energy, so the yen loses twice, through the trade balance and through the Fed. India and Turkey are the emerging-market losers. The euro is a net importer and has the extra problem that European growth is already weak.
The risk channel. A supply shock is a tax on growth. Equities fall, and the currencies that trade with equities, the Australian and New Zealand dollars, fall with them, while the franc and the dollar gain. This channel is the one that flips on a headline: the Tehran talks lifted AUD and NZD and pressured the dollar within an hour. The fundamental analysis guide covers the broader mechanics.
Which pairs, which way
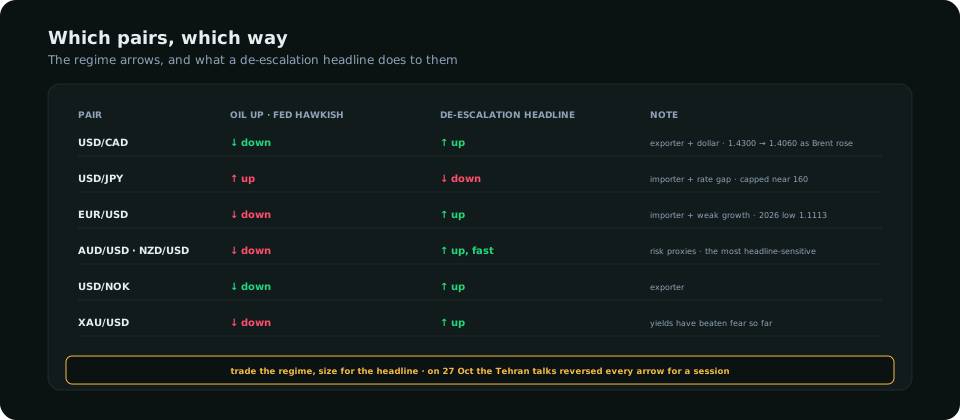
| Pair | Oil up, Fed hawkish | De-escalation headline | Note |
|---|---|---|---|
| USD/CAD | Down | Up | Exporter and dollar offset; CAD has won so far |
| USD/JPY | Up | Down | Importer and rate gap, but 160 is defended |
| EUR/USD | Down | Up | Importer, weak growth, 2026 low 1.1113 |
| AUD/USD, NZD/USD | Down | Up, fast | Risk proxies; the most headline-sensitive |
| XAU/USD | Down | Up | Yields have beaten fear; see the gold guide |
Trading a headline market
- Trade the regime, not the headline. The regime is oil high, yields high, dollar supported. Headlines produce one-session reversals inside it. A position aligned with the regime, entered on the pullback a de-escalation headline produces, has the structure behind it; a position chasing the headline does not.
- Stops beyond daily structure plus half an ATR. Headline spikes on USD/CAD and AUD/USD run 60–100 pips in minutes. A stop inside that range is a donation. If the stop is too wide for the account, the fix is a smaller lot, as the risk management guide sets out, not a tighter stop.
- No positions into the midterms without a plan. 3 November is both the election and the date the market has marked for possible strikes. Either hold with a stop that survives a $10 oil move, or be flat.
- Watch USD/CAD and USD/JPY as the pair. When both fall together, the market is in the terms-of-trade channel and the dollar is losing; when USD/JPY rises as USD/CAD falls, it is in the inflation channel and the dollar is winning. That read tells you which currency to be long against the yen.
The calendar guide explains how to handle scheduled releases; the point of this week is that the unscheduled ones are larger.
What to read in the terminal
The intermarket panel scores oil against the dollar, yields and the risk currencies, and it is the quickest way to see which channel is in charge on a given day. The Positioning dashboard shows the speculative position in the Canadian dollar and the yen; a crowded CAD long into a de-escalation headline is a sharper reversal than the chart alone suggests. The COT guide covers how to read that.
Frequently asked
Why does a high oil price strengthen the US dollar?
Two reasons that currently point the same way. The United States is a net energy exporter, so its terms of trade improve; and higher oil raises inflation, which keeps the Fed hiking and Treasury yields high. In 2026 the second reason has dominated.
Which currency benefits most from rising oil?
Among liquid currencies the Canadian dollar and the Norwegian krone. USD/CAD fell about 240 pips from its 14 October high as Brent rose through $110, even while the dollar was firm against the euro and the yen.
Which currencies lose from an oil shock?
Energy importers with weak growth or large deficits: the yen, the euro, the Indian rupee and the Turkish lira. The yen loses twice, through its trade balance and through the wider US rate gap, which is why USD/JPY is back near the levels Japan defended in the summer.
Everything on SMC Terminal is analysis and education, not a recommendation to buy or sell. Prices are as of 23–27 October 2026 and change continuously. Trading carries a substantial risk of loss. Manage your risk.