Best Indicators for Gold Trading: Trend, Momentum and Volatility
Gold trends harder, sweeps deeper and moves faster than a currency pair, so the indicators that work on EUR/USD need re-tuning before they work on XAUUSD. This comparison picks the best indicator for gold trading in each of three jobs — trend, momentum and volatility — explains the settings, and shows why the strongest gold signals come from data no chart indicator contains.
Ask which indicator is best for gold and you'll get a list of twenty, each recommended by someone who used it in a trending month. The honest answer has two parts. First, an indicator is only "best" for a job — reading the trend, judging momentum, or measuring volatility — and gold needs one of each, not twenty of one. Second, gold is unusually driven by things no chart indicator can see, so the best gold "indicator" is often a yields chart and a positioning report. This guide covers both parts.
What makes gold different
| Trait | Gold (XAUUSD) | Why it matters for indicators |
|---|---|---|
| Daily range | $35–60, around 1–1.5% of price | Fixed-pip stops fail; everything must be scaled by ATR |
| Trend persistence | Months-long trends, 10–15% corrections | Trend tools earn more here than on currencies; mean-reversion tools lose |
| Sweeps | Routinely 0.5–1 ATR beyond a level | Oscillators flash "oversold" on sweeps that reverse within the hour |
| Session character | Quiet Asia, violent London and New York opens | Volatility indicators must be read against the session, not the day |
| Drivers | Real yields, the dollar, central-bank demand, risk | The biggest moves start off-chart |
Job 1: reading the trend
Best: market structure, with a 50/200 EMA as the summary
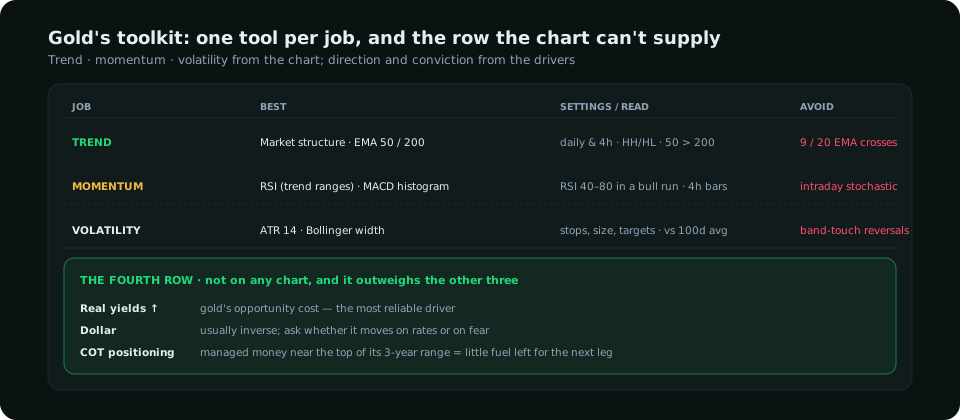
Nothing beats marking swing highs and lows on the daily and 4-hour chart — higher highs and higher lows is an uptrend, full stop (the gold structure guide shows how). For a one-glance summary, a 50-period and 200-period EMA on the daily chart has a good record on gold precisely because its trends persist: price above both with the 50 above the 200 is a bull phase worth respecting; a daily close below the 50 EMA has marked the start of most 10%+ corrections. On the 4-hour chart the same pair acts as dynamic support in a trend.
Avoid for trend: short moving averages (9, 20) on intraday charts — gold's sweeps cut through them several times a session — and any crossover system on the hourly, which whipsaws in the Asian range.
Job 2: judging momentum
Best: RSI, read with trend ranges; MACD histogram for timing
RSI works on gold only when the 70/30 lines are abandoned. In a gold bull run the daily RSI holds a 40–80 range for months; selling at 70 means selling every rally. Use it as a regime read (where have the lows been bottoming?) and for divergence at a level. The MACD histogram on the 4-hour chart is the better timing tool on gold: its bars shrink a few candles before a pullback starts, and the first growing bar after a pullback into demand is a clean "momentum is back" cue.
Avoid for momentum: the stochastic on intraday gold — it pins at the extremes through the London and New York opens, when the real moves happen.
Job 3: measuring volatility
Best: ATR (14) — the one indicator every gold trader needs
Average True Range is not a signal; it is a ruler, and on gold it is the ruler everything else is measured with:
- Stops: beyond the structure or the sweep plus 0.3–0.5 of the hourly ATR for intraday entries, 0.5 of the 4-hour ATR for swing entries. A stop set in dollars without reference to ATR is either hit by noise or far wider than it needs to be.
- Position size: because the stop is in ATR, the size follows from it — see the position size guide, where gold's 100-ounce lot catches people out.
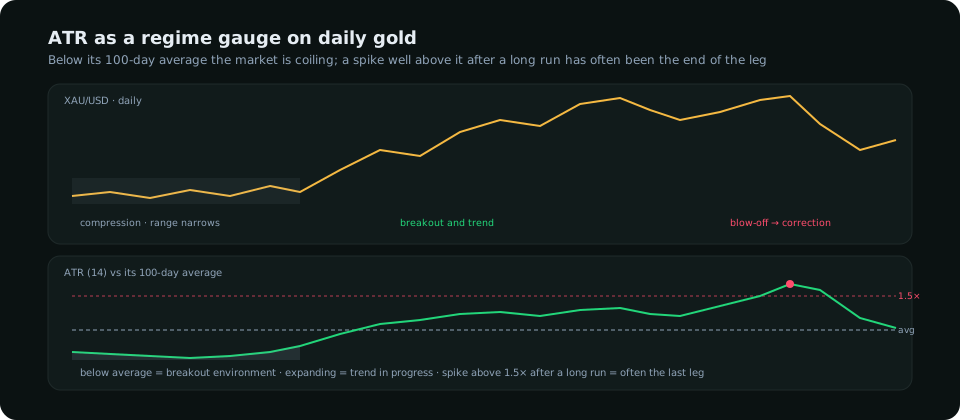
- Regime: the 14-day ATR against its 100-day average. Below average is compression, the environment breakouts come from; a daily ATR expanding past 1.5× its average after a long run is often the blow-off phase.
- Targets: a first target one daily ATR from entry is reached on the majority of trending days; two ATRs is a good day.
Also useful: Bollinger Band width
The distance between the bands (20-period, 2 standard deviations) on the daily chart compresses before gold's largest moves and expands through them. Use the width as a squeeze indicator; ignore band "touches" as reversal signals, which on gold they are not.
The fourth row: what the chart cannot see
Gold's largest moves begin with changes in three things, and a trader who watches only indicators sees them late:
- Real yields. Gold pays no interest, so when inflation-adjusted Treasury yields rise, gold's opportunity cost rises and it tends to fall — the single most reliable driver. A bullish 4-hour structure with real yields breaking higher is a structure likely to fail.
- The dollar. Usually inverse, but not always; what matters is whether the dollar is moving on rates or on fear.
- Positioning. When managed money in COMEX gold is at the top of its three-year range (the COT read), the buyers of the next breakout are already in. Indicators will still say "momentum strong" at that moment; the report says the fuel is low.
A practical setup puts these beside the chart — a yields chart and the CFTC's weekly report open in a second tab, or a dashboard that composes them into one read per market. Either way, a gold trade should be able to answer "what are real yields and positioning doing?" before the first indicator is consulted.
A settings table for XAUUSD
| Indicator | Timeframe | Settings | Use |
|---|---|---|---|
| EMA 50 / 200 | Daily, 4-hour | Defaults | Trend phase; dynamic support/resistance |
| RSI | Daily, 4-hour | 14; read 40–80 in uptrends, 20–60 in downtrends | Regime; divergence at a level |
| MACD | 4-hour | 12 / 26 / 9 | Histogram for pullback timing; zero line for bias |
| ATR | Hourly, 4-hour, daily | 14 | Stops, size, targets, regime vs 100-day average |
| Bollinger width | Daily | 20, 2 SD | Squeeze before expansion |
| Session boxes | Hourly | Asia, London, New York | Where the sweeps and the real moves happen |
Putting it together
- Daily: structure and the 50/200 EMAs say which way. Real yields, the dollar and positioning say how much to trust it.
- 4-hour: RSI trend range confirms the regime; the MACD histogram shows the pullback fading.
- Hourly: a sweep of a session low into a 4-hour zone, a close back above, and the entry on the retest; stop at 0.4 ATR beyond the wick; first target one daily ATR away.
Three indicators with three jobs, one ruler, and a look at what drives the metal. That is a complete toolkit for gold; a twentieth indicator adds nothing the first three didn't already say.
Everything on SMC Terminal is analysis and education, not a recommendation to buy or sell. Trading carries a substantial risk of loss. Manage your risk.