How to Use the ATR Indicator to Understand Forex Volatility
Average True Range is the one indicator every forex trader should keep on the chart, because it measures the thing stops, targets and size all depend on: how far this market moves. This tutorial shows how ATR is calculated, how to read it by pair and timeframe, and the four ways to use it — stops, targets, sizing and regime — with worked numbers.
Average True Range (ATR) measures how far a market moves per candle, on average, over a lookback — usually 14 periods. It says nothing about direction. That is exactly why it is the most useful indicator on a forex chart: stops, targets and position size all depend on distance, and ATR is the ruler. This tutorial shows how ATR is calculated, what typical values look like across pairs and timeframes, and the four jobs it does in a trading plan, each with worked numbers.
How ATR is calculated
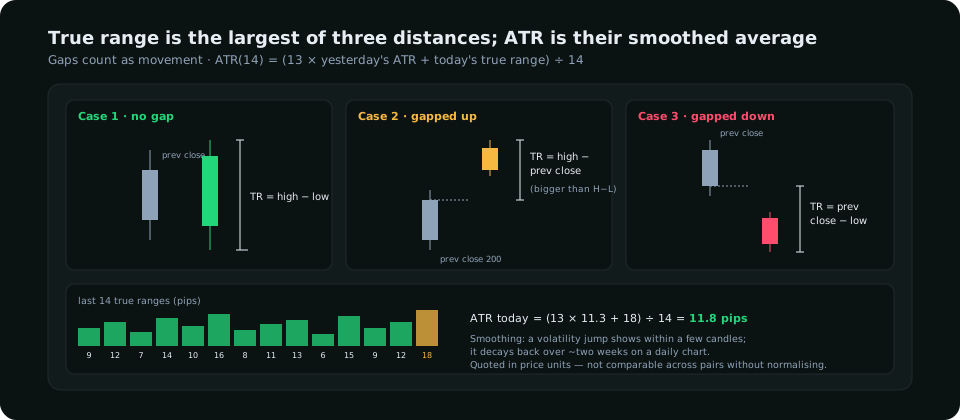
Each candle's true range is the largest of three numbers: the candle's high minus its low; the high minus the previous close; and the previous close minus the low. The second and third cases exist so that a gap — a Monday open far from Friday's close — is counted as movement even though the candle itself may be small. ATR is then the average of the last N true ranges, smoothed so that each new value is (13 × yesterday's ATR + today's true range) ÷ 14. The smoothing means ATR responds to a volatility jump within a few candles and decays back over about two weeks on a daily chart.
ATR is quoted in price units: pips on a forex pair, dollars on gold. It is not comparable across pairs without normalising — a 60-pip ATR on EUR/USD and a 110-pip ATR on GBP/JPY are both "normal".
Typical values
| Market | Daily ATR(14), normal regime | 4-hour | 15-minute |
|---|---|---|---|
| EUR/USD | 55–80 pips | 20–30 | 6–12 |
| GBP/USD | 80–120 | 30–45 | 8–15 |
| USD/JPY | 70–110 | 25–40 | 7–14 |
| GBP/JPY | 120–180 | 45–70 | 12–22 |
| Gold (XAU/USD) | $30–60 | $10–20 | $3–6 |
The ranges are wide because volatility has regimes; the volatility guide covers the regimes in detail. The point of the table is the ratio between markets: whatever is being measured in ATR on EUR/USD, the same plan on GBP/JPY needs roughly twice the pips.
Four uses
1. Stops
The stop goes beyond the structure that defines the trade plus a buffer of 0.3–0.5 × ATR of the trading timeframe, so that ordinary overshoot does not reach it. Where there is no single structural level (a systematic trend entry), 1.5–2 × ATR from entry is the standard. The stop-loss guide works through both.
2. Targets
A first target one daily ATR from entry is reached on most trending days; two is a strong day. Measuring targets in ATR keeps them realistic: a 100-pip target on EUR/USD with a 60-pip daily ATR needs two good days, and the plan should say so.
3. Size
Because the stop is in ATR, size follows automatically: risk in money ÷ (stop distance × pip value). When ATR doubles, the stop doubles and the position halves, and the risk in money is unchanged. This is the mechanism that keeps a method alive across regimes. The position size calculator article has the arithmetic.
4. Regime
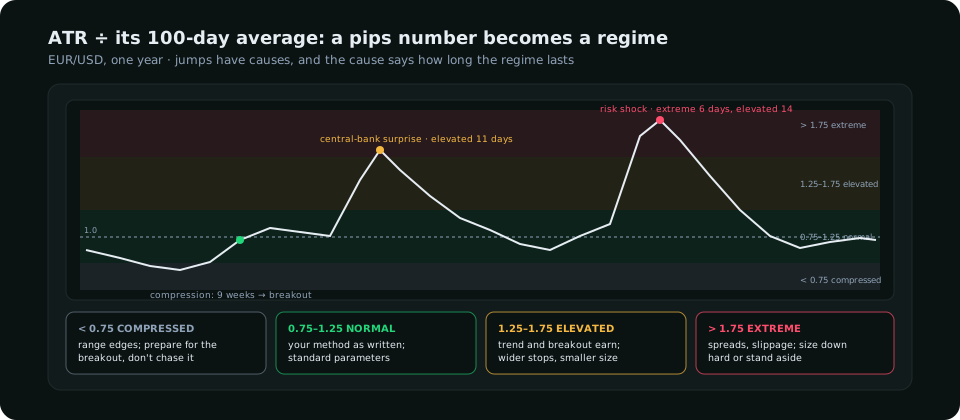
ATR(14) ÷ ATR's own 100-day average is a regime gauge: below 0.75 the market is compressed and breakouts are likely; above 1.25 it is elevated and trend methods earn while mean-reversion bleeds; above 1.75 spreads and slippage make most intraday methods unprofitable. A trader who checks this ratio once a day knows which of their methods to run.
A worked plan in ATR
| Item | EUR/USD, daily ATR 64 pips, 15-min ATR 11 pips |
|---|---|
| Regime | ATR ÷ 100-day avg = 64 ÷ 70 = 0.91 → normal |
| Stop buffer | 0.4 × 11 = 4.4 → 5 pips beyond the sweep wick |
| Stop distance | Entry to stop = 28 pips |
| Size | $100 risk ÷ (28 × $10) = 0.36 lots |
| First target | 1 × daily ATR = 64 pips → 2.3R |
| Day's range used | Already moved 40 of 64 pips by London → 24 pips of "normal" range left; a late entry has less room |
Mistakes
Reading ATR as direction. Rising ATR means bigger candles, in either direction; a falling ATR during an uptrend does not mean the trend is ending, it means it is orderly. One multiple for every pair. A 1 × ATR stop is sensible on a trend entry and absurd as a buffer behind a structural level; the multiple depends on the job. Ignoring the regime. A plan tuned in a normal regime with fixed-pip targets will fail in compression (never reached) and in the extreme regime (reached and reversed). ATR on the wrong timeframe. A 15-minute stop uses the 15-minute ATR; the daily ATR is for targets and regime.
Frequently asked
What is the best ATR setting for forex?
14 periods on every timeframe. It is the default everywhere, which makes values comparable across platforms and with other traders' stops, and shorter settings add noise without adding information.
Is ATR a leading or lagging indicator?
Lagging, by construction — it averages past ranges. Its use is as a ruler for the present (stops, size), not as a forecast, though the regime ratio does say which kind of market you are in.
How is ATR different from Bollinger Bands?
Both measure volatility. ATR gives a single distance in pips; Bollinger Bands draw a standard-deviation envelope around a moving average. ATR is the simpler tool for stops and size; bands are a visual for squeezes.
Everything on SMC Terminal is analysis and education, not a recommendation to buy or sell. ATR values and thresholds are typical figures for illustration. Trading carries a substantial risk of loss. Manage your risk.