Forex Technical Analysis: A Practical Guide to Reading Price Charts
Forex technical analysis is the discipline of reading what price has already done to decide what is worth doing next. This guide strips it to the four readings that matter on a currency chart: trend by swing points, the levels where price has reacted, the state of the current range, and momentum as a tie-breaker. It works top-down from the daily chart to the hourly, with a worked EUR/USD read and the habits that stop chart reading from becoming pattern hunting.
Forex technical analysis has a reputation problem it mostly deserves. Taught as a catalogue of patterns and indicators, it produces traders who can name a head-and-shoulders and still cannot say which way the market is going. Practised as a small set of readings taken in a fixed order, it does something useful: it tells you the direction price is travelling, the levels where it has reacted before, where in its range it sits now, and whether the move has energy left. Those four readings, taken from the daily chart down to the hourly, are the whole of practical chart reading. This guide covers each one, the order to take them in, and a worked example on EUR/USD.
Reading 1: trend, by swing points only
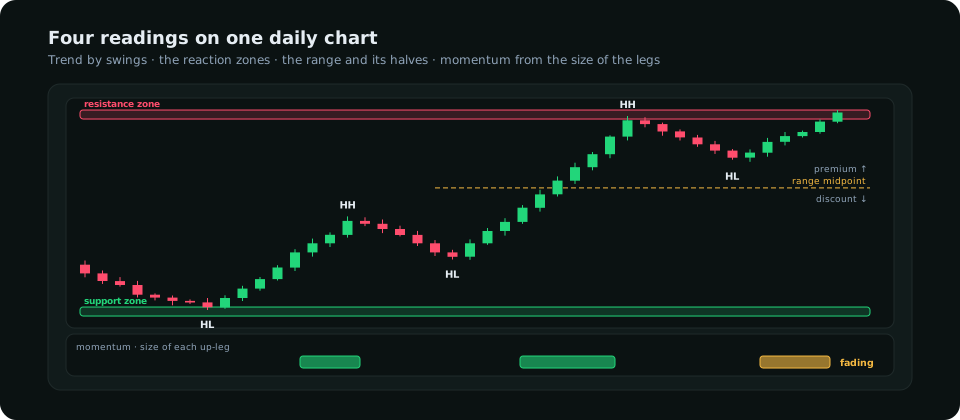
A trend is a sequence of swing highs and swing lows. Price is in an uptrend while it prints higher highs and higher lows, in a downtrend while it prints lower highs and lower lows, and in a range when it does neither. That is the entire definition; moving averages and trend lines are approximations of it. Mark the last three swing highs and lows on the daily chart and the trend is read. The most recent swing is the one that matters: an uptrend ends not when price falls but when it closes below the last higher low, which is a break of structure in the other direction. Until that happens, pullbacks are pullbacks.
Reading 2: the zones where price has reacted
Support and resistance are not lines but zones: areas a few pips to a few dozen pips wide where price has turned more than once. The reliable ones share three properties. They were formed by a sharp rejection (a long wick or a fast reversal, not a slow drift). They have been tested fewer than three times, because each test consumes the orders that made the zone. And they coincide with something else: a round number, a previous day's or week's extreme, the origin of a strong move. Mark no more than three above and three below the current price on the daily chart; more than that is a chart full of lines that cannot all matter. The support and resistance guide goes into the identification rules in detail.
Reading 3: where price sits in its range
Between the last significant swing low and swing high lies the dealing range, and its midpoint divides it into a premium half (above) and a discount half (below). The reading is simple and widely ignored: longs taken in the discount half have room to the top of the range; longs taken in the premium half are buying near where the last sellers appeared. In an uptrend, the setup is a pullback into discount; in a downtrend, a rally into premium. A trend read that is right and a location read that is wrong is still a losing trade. The premium and discount article covers how to draw the range and when to redraw it.
Reading 4: momentum as the tie-breaker
Momentum is the size and speed of the impulse legs. Compare the last three legs in the trend's direction: if each is smaller than the one before, the trend is tiring; if the latest is the largest, it is accelerating. Candle bodies tell the same story on a shorter horizon: a trend whose candles have shrunk to dojis near a resistance zone is a trend asking to be faded. An oscillator such as the RSI can formalise this, and divergence between price making a new high and the oscillator failing to is the classic warning. Momentum never decides the direction; it adjusts the confidence and the size.
The order and the timeframes
| Timeframe | Readings taken | Decides | Re-read |
|---|---|---|---|
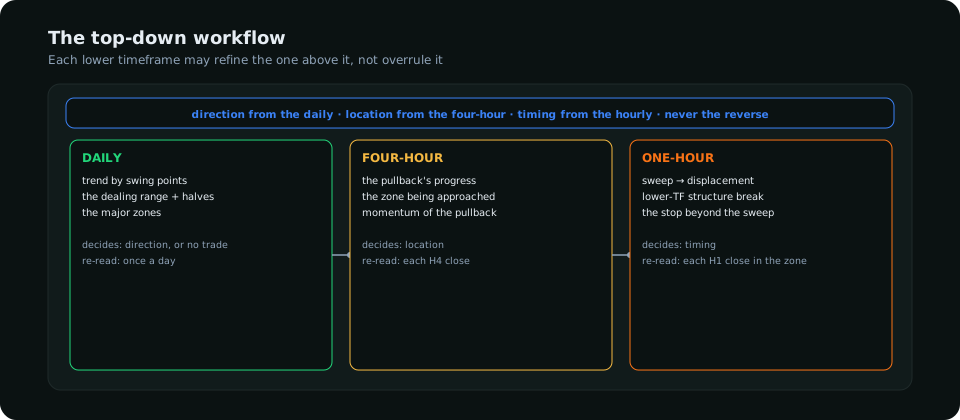
| Daily | Trend by swings · the range and its halves · the major zones | Direction, and whether to trade at all | Once a day, after the close |
| Four-hour | The pullback's progress · the zone being approached · momentum of the pullback | Location: where to look for an entry | Each four-hour close |
| One-hour | The trigger: sweep, displacement, lower-timeframe structure break · the stop | Timing | Each hourly close while in the zone |
The daily chart is read first and its verdict is binding. Hourly charts are full of counter-trend "setups" that are nothing but the pullback the daily chart already expects; reading the hourly first is how traders end up short in uptrends. The market analysis guide places this chart work inside the wider routine of macro and positioning reads.
A worked EUR/USD read
Daily: the last three swings are a higher low at 1.0790, a higher high at 1.0940, and a current pullback that has not yet closed below 1.0790. Trend: up. Range: 1.0790 to 1.0940, midpoint 1.0865; price at 1.0820 is in discount. Zones: a daily demand zone at 1.0800 to 1.0815 formed by the sharp rejection that started the last leg, tested once; resistance at 1.0935 to 1.0950 where the last high stalled. Momentum: the last three up-legs were 90, 110 and 150 pips, so accelerating. Four-hour: the pullback has been three days of overlapping candles with shrinking ranges, which is corrective, not impulsive, and price is now inside the demand zone. One-hour: waiting for a sweep of the zone's low and a close back above 1.0815. The read is long, from the zone, on the trigger, with the stop below the zone and the first target at the midpoint and the second at the resistance zone. If the daily instead closed below 1.0790, every line of this read would be void and the chart would be re-read from scratch as a possible downtrend.
What technical analysis cannot do
- Tell you why. The chart shows that price turned at 1.0800; the rate differential and the positioning explain why, and they say whether it will again. The COT read is the complement, not the competitor.
- Survive a release. A clean technical setup fifteen minutes before a rate decision is a coin flip; the calendar is a precondition for every reading above.
- Work at every scale. The readings hold on daily and four-hour charts, degrade on the hourly, and are mostly noise below fifteen minutes, where spreads and order flow dominate.
Habits that keep it honest
Write the four readings down before looking for an entry, in the same order every day; if the trend reading is "unclear", stop there. Keep the chart to swings, zones and the range; every added indicator is a second opinion from the same data. Mark levels on the higher timeframe only, so the hourly chart is not covered in lines. And review weekly which readings were right: most traders find their trend reads are good and their location reads are the ones costing money. Moving averages and the indicator overview are there for traders who want a mechanical version of these readings; the readings themselves need nothing but the candles.
Frequently asked
Is technical analysis enough to trade forex?
It decides location and timing well and direction adequately. Combined with a positioning and macro read for direction, it is most of what a discretionary forex trader uses. On its own it leaves the trader fighting the fundamentals on the days that matter most.
Which timeframe is best for forex technical analysis?
Daily for the decision, four-hour for the location, hourly for the trigger. Charts below fifteen minutes add noise faster than they add information.
Do chart patterns work in forex?
The ones that describe structure (a higher low holding, a range breaking) do, because they are the trend reading under another name. The ones that describe shapes (flags, wedges, head-and-shoulders) work when they coincide with a structural reading and are decorative when they do not.
Everything on SMC Terminal is analysis and education, not a recommendation to buy or sell. Figures in the example are illustrative. Trading carries a substantial risk of loss. Manage your risk.